We put the Sony Xperia 5 V through our rigorous DXOMARK Camera test suite to measure its performance in photo, video, and zoom quality from an end-user perspective. This article breaks down how the device fared in a variety of tests and several common use cases and is intended to highlight the most important results of our testing with an extract of the captured data.
Overview
Key camera specifications:
- Primary: 48MP sensor, 1.12µm pixels, 24mm equivalent f/1.9-aperture lens, Dual Pixel PDAF, OIS
- Ultra-wide: 12MP sensor, 16mm equivalent f/2.2-aperture lens, Dual Pixel PDAF
Scoring
Sub-scores and attributes included in the calculations of the global score.
 Sony Xperia 5 V

118
camera
99
Huawei Pura 70 Ultra
Best: Huawei Pura 70 Ultra (130)
112
Apple iPhone 16 Pro
Best: Apple iPhone 16 Pro (130)
93
Huawei Pura 70 Ultra
Best: Huawei Pura 70 Ultra (125)
103
Xiaomi 15 Ultra
Best: Xiaomi 15 Ultra (125)
98
Huawei Pura 70 Ultra
Best: Huawei Pura 70 Ultra (117)
70
Xiaomi Redmi 12 5G
Best: Xiaomi Redmi 12 5G (82)
60
Huawei Pura 70 Ultra
Best: Huawei Pura 70 Ultra (85)
58
Apple iPhone 16 Pro
Best: Apple iPhone 16 Pro (93)
57
Xiaomi 15 Ultra
Best: Xiaomi 15 Ultra (128)
82
Huawei Pura 70 Ultra
Best: Huawei Pura 70 Ultra (122)
86
Oppo Find X8 Pro
Best: Oppo Find X8 Pro (116)
86
Oppo Find X8 Pro
Best: Oppo Find X8 Pro (120)
96
Huawei Pura 70 Ultra
Best: Huawei Pura 70 Ultra (120)
93
Oppo Find X6 Pro
Best: Oppo Find X6 Pro (118)
109
Apple iPhone 16 Pro
Best: Apple iPhone 16 Pro (120)
82
Xiaomi 12S Ultra
Best: Xiaomi 12S Ultra (86)
104
Apple iPhone 16 Pro
Best: Apple iPhone 16 Pro (119)
Use cases & Conditions
Use case scores indicate the product performance in specific situations. They are not included in the overall score calculations.
Outdoor
Photos & videos shot in bright light conditions (≥1000 lux)
Indoor
Photos & videos shot in good lighting conditions (≥100lux)
Lowlight
Photos & videos shot in low lighting conditions (<100 lux)
Friends & Family
Portrait and group photo & videos
Position in Global Ranking

111
th
4. Apple iPhone 16 Pro Max
157
10. Apple iPhone 15 Pro Max
154
22. Honor Magic4 Ultimate
147
26. Apple iPhone 14 Pro Max
146
26. Motorola Edge 50 Ultra
146
26. Samsung Galaxy S25 Ultra
146
32. Samsung Galaxy S24 Ultra
144
34. Apple iPhone 13 Pro Max
141
34. Google Pixel 9 Pro Fold
141
38. Samsung Galaxy S23 Ultra
140
43. Tecno Camon 40 Pro 5G
138
45. Vivo X80 Pro (Snapdragon)
137
52. Samsung Galaxy S22 Ultra (Snapdragon)
135
52. Vivo X80 Pro (MediaTek)
135
59. Samsung Galaxy Z Fold6
133
59. Samsung Galaxy S24+ (Exynos)
133
59. Samsung Galaxy S24 FE
133
59. Samsung Galaxy S24 (Exynos)
133
69. Samsung Galaxy Z Flip6
132
70. Apple iPhone 12 Pro Max
131
70. Samsung Galaxy S22 Ultra (Exynos)
131
81. Samsung Galaxy Z Fold5
128
83. Asus Smartphone for Snapdragon Insiders
127
83. Samsung Galaxy Z Flip5
127
83. Samsung Galaxy S23 FE
127
88. Vivo X70 Pro (MediaTek)
126
92. Asus Zenfone 11 Ultra
125
92. Samsung Galaxy S22+ (Exynos)
125
97. Samsung Galaxy Z Fold4
124
100. Apple iPhone 11 Pro Max
122
105. Xiaomi Redmi Note 13 Pro Plus 5G
121
106. Samsung Galaxy Z Fold3 5G
120
106. Samsung Galaxy S22 (Exynos)
120
106. Xiaomi Redmi Note 13 Pro 5G
120
111. Xiaomi Redmi Note 14 Pro+ 5G
118
114. Apple iPhone 12 mini
117
114. Samsung Galaxy S21 Ultra 5G (Snapdragon)
117
114. Samsung Galaxy S21 FE 5G (Snapdragon)
117
114. Samsung Galaxy S21 5G (Snapdragon)
117
120. Vivo X60 Pro 5G (Snapdragon)
116
123. Motorola Edge 50 Neo
115
123. Samsung Galaxy S21+ 5G (Snapdragon)
115
123. Samsung Galaxy S21 Ultra 5G (Exynos)
115
133. Crosscall Stellar-X5
113
133. Xiaomi Redmi Note 12 Pro+ 5G
113
137. Samsung Galaxy Z Flip4
112
139. Samsung Galaxy Z Flip3 5G
111
139. Samsung Galaxy S21+ 5G (Exynos)
111
139. Samsung Galaxy S21 5G (Exynos)
111
144. Samsung Galaxy A55 5G
108
144. Vivo X60 Pro 5G (Exynos)
108
149. Samsung Galaxy A54 5G
107
150. Xiaomi Redmi Note 14 Pro 5G
106
153. Samsung Galaxy A35 5G
104
154. Motorola Edge 40 Neo
103
154. Xiaomi Redmi Note 14 5G
103
156. Xiaomi Redmi Note 12 Pro 5G
102
158. Motorola Edge 30 Pro
101
160. Apple iPhone SE (2022)
100
162. Motorola Moto g75 5G
96
168. Samsung Galaxy A34 5G
92
168. Samsung Galaxy A25 5G
92
172. Xiaomi Redmi Note 13 5G
91
174. Motorola Moto g85 5G
88
174. Samsung Galaxy A52s 5G
88
174. Samsung Galaxy A52 5G
88
178. Motorola moto g54 5G
85
178. Samsung Galaxy A33 5G
85
178. Samsung Galaxy A16 LTE
85
181. Honor Magic6 Lite (5300 mAh)
84
181. Xiaomi Redmi Note 14
84
184. Samsung Galaxy A15 5G
83
186. Samsung Galaxy A15 LTE
81
187. Samsung Galaxy A53 5G
79
189. Xiaomi Redmi Note 11 Pro 5G
78
191. Samsung Galaxy A16 5G
77
193. Motorola Moto G35 5G
75
193. Xiaomi Redmi Note 13
75
196. Honor Magic5 Lite 5G
74
198. Samsung Galaxy A23 5G
70
199. Xiaomi Redmi Note 12 5G
69
202. Motorola moto g34 5G
67
202. Samsung Galaxy A14 5G
67
204. Motorola Moto G62 5G
66
205. Xiaomi Redmi Note 11S 5G
65
207. Xiaomi Redmi Note 12
63
212. Honor Magic4 Lite 5G
61
214. Xiaomi Redmi Note 11
60
216. Crosscall Stellar-M6
59
223. Xiaomi Redmi 10 2022
51
225. Samsung Galaxy A22 5G
48
Position in Ultra-Premium Ranking
79
th
4. Apple iPhone 16 Pro Max
157
10. Apple iPhone 15 Pro Max
154
20. Honor Magic4 Ultimate
147
23. Apple iPhone 14 Pro Max
146
23. Motorola Edge 50 Ultra
146
23. Samsung Galaxy S25 Ultra
146
28. Samsung Galaxy S24 Ultra
144
30. Apple iPhone 13 Pro Max
141
30. Google Pixel 9 Pro Fold
141
34. Samsung Galaxy S23 Ultra
140
38. Vivo X80 Pro (Snapdragon)
137
43. Samsung Galaxy S22 Ultra (Snapdragon)
135
43. Vivo X80 Pro (MediaTek)
135
48. Samsung Galaxy Z Fold6
133
48. Samsung Galaxy S24+ (Exynos)
133
53. Samsung Galaxy Z Flip6
132
54. Apple iPhone 12 Pro Max
131
54. Samsung Galaxy S22 Ultra (Exynos)
131
61. Samsung Galaxy Z Fold5
128
63. Asus Smartphone for Snapdragon Insiders
127
63. Samsung Galaxy Z Flip5
127
68. Asus Zenfone 11 Ultra
125
68. Samsung Galaxy S22+ (Exynos)
125
71. Samsung Galaxy Z Fold4
124
73. Apple iPhone 11 Pro Max
122
76. Samsung Galaxy Z Fold3 5G
120
81. Samsung Galaxy S21 Ultra 5G (Snapdragon)
117
83. Samsung Galaxy S21+ 5G (Snapdragon)
115
83. Samsung Galaxy S21 Ultra 5G (Exynos)
115
89. Samsung Galaxy Z Flip4
112
90. Samsung Galaxy Z Flip3 5G
111
90. Samsung Galaxy S21+ 5G (Exynos)
111
Pros
- Good detail in most conditions
- Fairly accurate white balance in bright light and indoor conditions
- Well exposed subjects in tele shots, even with backlighting
Cons
- Reliable autofocus but noticeable capture delay in high-contrast scenes
- Preview image different to final capture
- Slow white balance transition in video
- Strong orange cast in low-light video
In our DXOMARK Camera tests the Sony Xperia 5 V showed improvements over the predecessor Xperia IV in both the photo and video categories. However, the omission of a dedicated tele camera module on the latest model means that performance in the zoom category has actually decreased compared to last year’s device, and overall the Sony is not making it anywhere close to the top of our ranking.
Still images captured with the Xperia 5 V showed good exposure in daylight and indoor conditions. Our testers also liked the well-controlled noise but criticized the limited dynamic range when shooting high-contrast scenes. Video mode offered a stable autofocus and effective brightness management in bright light. However, like in photo mode, dynamic range was limited, and video noise was noticeable in all light conditions.
Test summary
About DXOMARK Camera tests: DXOMARK’s Camera evaluations take place in laboratories and in real-world situations using a wide variety of subjects. The scores rely on objective tests for which the results are calculated directly by measurement software on our laboratory setups, and on perceptual tests in which a sophisticated set of metrics allow a panel of image experts to compare aspects of image quality that require human judgment. Testing a smartphone involves a team of engineers and technicians for about a week. Photo, Zoom, and Video quality are scored separately and then combined into an Overall score for comparison among the cameras in different devices. For more information about the DXOMARK Camera protocol, click here. More details on smartphone camera scores are available here. The following section gathers key elements of DXOMARK’s exhaustive tests and analyses. Full performance evaluations are available upon request. Please contact us on how to receive a full report.
Sony Xperia 5 V Camera Scores
This graph compares DXOMARK photo, zoom and video scores between the tested device and references. Average and maximum scores of the price segment are also indicated. Average and maximum scores for each price segment are computed based on the DXOMARK database of devices tested.
Photo
124
Huawei Pura 70 Ultra
Huawei Pura 70 Ultra
About DXOMARK Camera Photo tests
For scoring and analysis, DXOMARK engineers capture and evaluate more than 2,600 test images both in controlled lab environments and in outdoor, indoor and low-light natural scenes, using the camera’s default settings. The photo protocol is designed to take into account the main use cases and is based on typical shooting scenarios, such as portraits, family, and landscape photography. The evaluation is performed by visually inspecting images against a reference of natural scenes, and by running objective measurements on images of charts captured in the lab under different lighting conditions from 1 to 1,000+ lux and color temperatures from 2,300K to 6,500K.
Sony Xperia 5 V Photo scores
The photo tests analyze image quality attributes such as exposure, color, texture, and noise in various light conditions. Autofocus performances and the presence of artifacts on all images captured in controlled lab conditions and in real-life images are also evaluated. All these attributes have a significant impact on the final quality of the images captured with the tested device and can help to understand the camera's main strengths and weaknesses.
99
Huawei Pura 70 Ultra
Huawei Pura 70 Ultra
112
Apple iPhone 16 Pro
Apple iPhone 16 Pro
Exposure and color are the key attributes for technically good pictures. For exposure, the main attribute evaluated is the brightness of the main subject through various use cases such as landscape, portrait, or still life. Other factors evaluated are the contrast and the dynamic range, eg. the ability to render visible details in both bright and dark areas of the image. Repeatability is also important because it demonstrates the camera's ability to provide the same rendering when shooting several images of the same scene.
For color, the image quality attributes analyzed are skin-tone rendering, white balance, color shading, and repeatability. For color and skin tone rendering, we penalize unnatural colors but we respect a manufacturer's choice of color signature.
Sony Xperia 5 V – Accurate face exposure, limited dynamic range, slight
clipping in
background
Honor 90 – Better exposure trade-off between face and background
Samsung Galaxy A34 G – Strong highlight clipping in the background.
93
Huawei Pura 70 Ultra
Huawei Pura 70 Ultra
Autofocus tests concentrate on focus accuracy, focus repeatability, shooting time delay, and depth of field. Shooting delay is the difference between the time the user presses the capture button and the time the image is actually taken. It includes focusing speed and the capability of the device to capture images at the right time, what is called 'zero shutter lag' capability. Even if a shallow depth of field can be pleasant for a single subject portrait or close-up shot, it can also be a problem in some specific conditions such as group portraits; Both situations are tested. Focus accuracy is also evaluated in all the real-life images taken, from infinity to close-up objects and in low light to outdoor conditions.
Autofocus irregularity and speed: 1000Lux Δ0EV Daylight Handheld
This graph illustrates focus accuracy and speed and also zero shutter lag capability by showing the edge acutance versus the shooting time measured on the AFHDR setup on a series of pictures. All pictures were taken at 1000Lux with Daylight illuminant, 500ms after the defocus. The edge acutance is measured on the four edges of the Dead Leaves chart, and the shooting time is measured on the LED Universal Timer.
103
Xiaomi 15 Ultra
Xiaomi 15 Ultra
Texture tests analyze the level of details and the texture of subjects in the images taken in the lab as well as in real-life scenarios. For natural shots, particular attention is paid to the level of details in the bright and dark areas of the image. Objective measurements are performed on chart images taken in various lighting conditions from 1 to 1000 lux and different kinds of dynamic range conditions. The charts used are the proprietary DXOMARK chart (DMC) and the Dead Leaves chart.
DXOMARK CHART (DMC) detail preservation score vs lux levels for tripod and handheld conditions
This graph shows the evolution of the DMC detail preservation score with the level of lux, for two holding conditions. DMC detail preservation score is derived from an AI-based metric trained to evaluate texture and details rendering on a selection of crops of our DXOMARK chart.
98
Huawei Pura 70 Ultra
Huawei Pura 70 Ultra
Noise tests analyze various attributes of noise such as intensity, chromaticity, grain, structure on real-life images as well as images of charts taken in the lab. For natural images, particular attention is paid to the noise on faces, landscapes, but also on dark areas and high dynamic range conditions. Noise on moving objects is also evaluated on natural images. Objective measurements are performed on images of charts taken in various conditions from 1 to 1000 lux and different kinds of dynamic range conditions. The chart used is the Dead Leaves chart and the standardized measurement such as Visual Noise derived from ISO 15739.
Visual noise evolution with illuminance levels in handheld condition
This graph shows the evolution of visual noise metric with the level of lux in handheld condition. The visual noise metric is the mean of visual noise measurement on all patches of the Dead Leaves chart in the AFHDR setup. DXOMARK visual noise measurement is derived from ISO15739 standard.
70
Xiaomi Redmi 12 5G
Xiaomi Redmi 12 5G
The artifacts evaluation looks at lens shading, chromatic aberrations, geometrical distortion, edges ringing, halos, ghosting, quantization, unexpected color hue shifts, among others type of possible unnatural effects on photos. The more severe and the more frequent the artifact, the higher the point deduction on the score. The main artifacts observed and corresponding point loss are listed below.
Main photo artifacts penalties
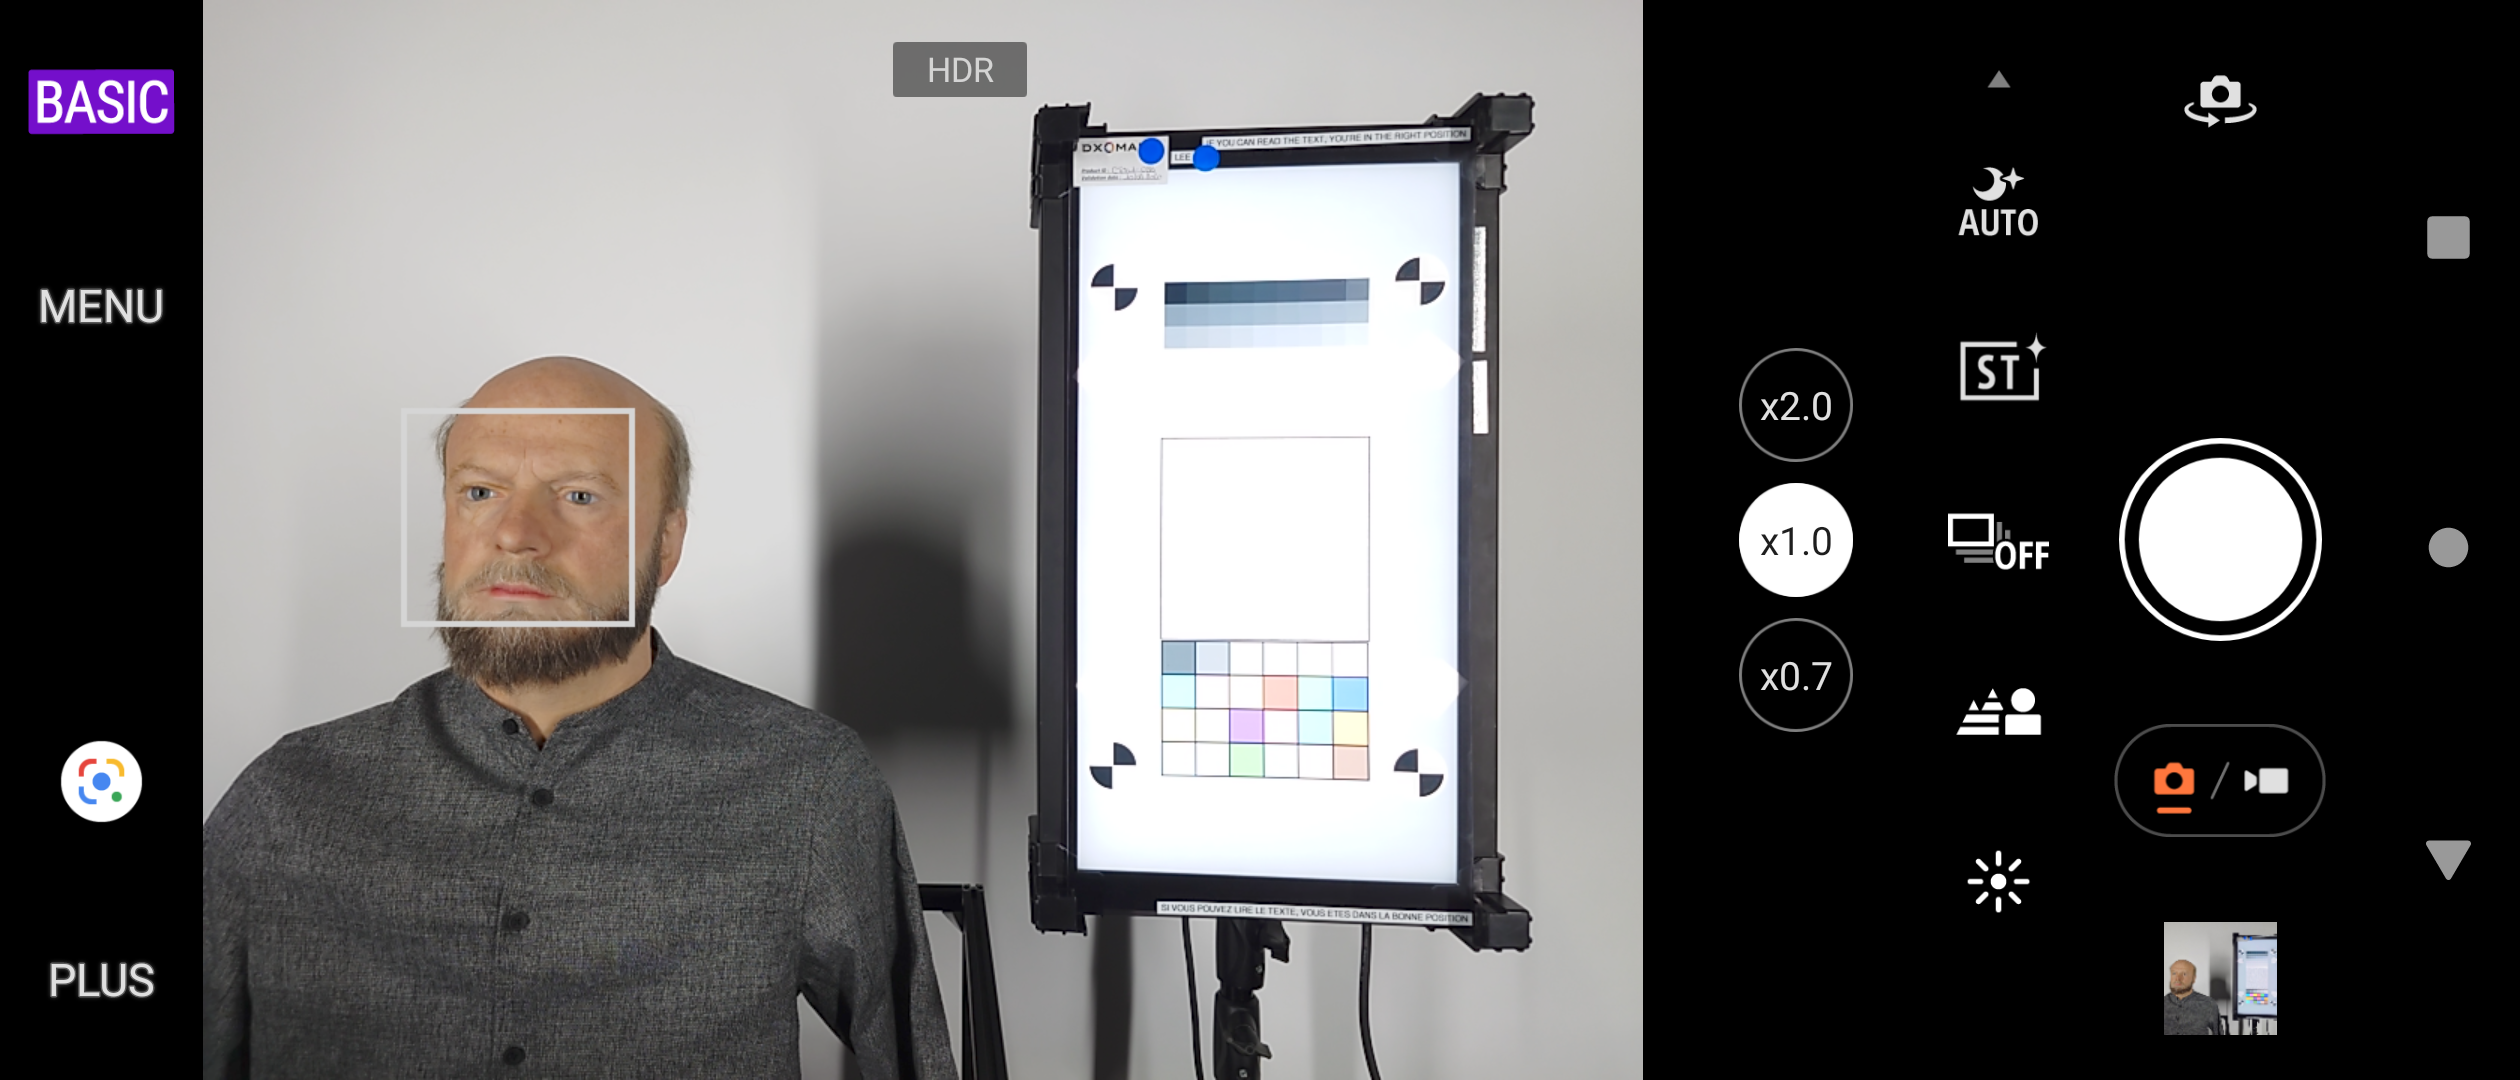
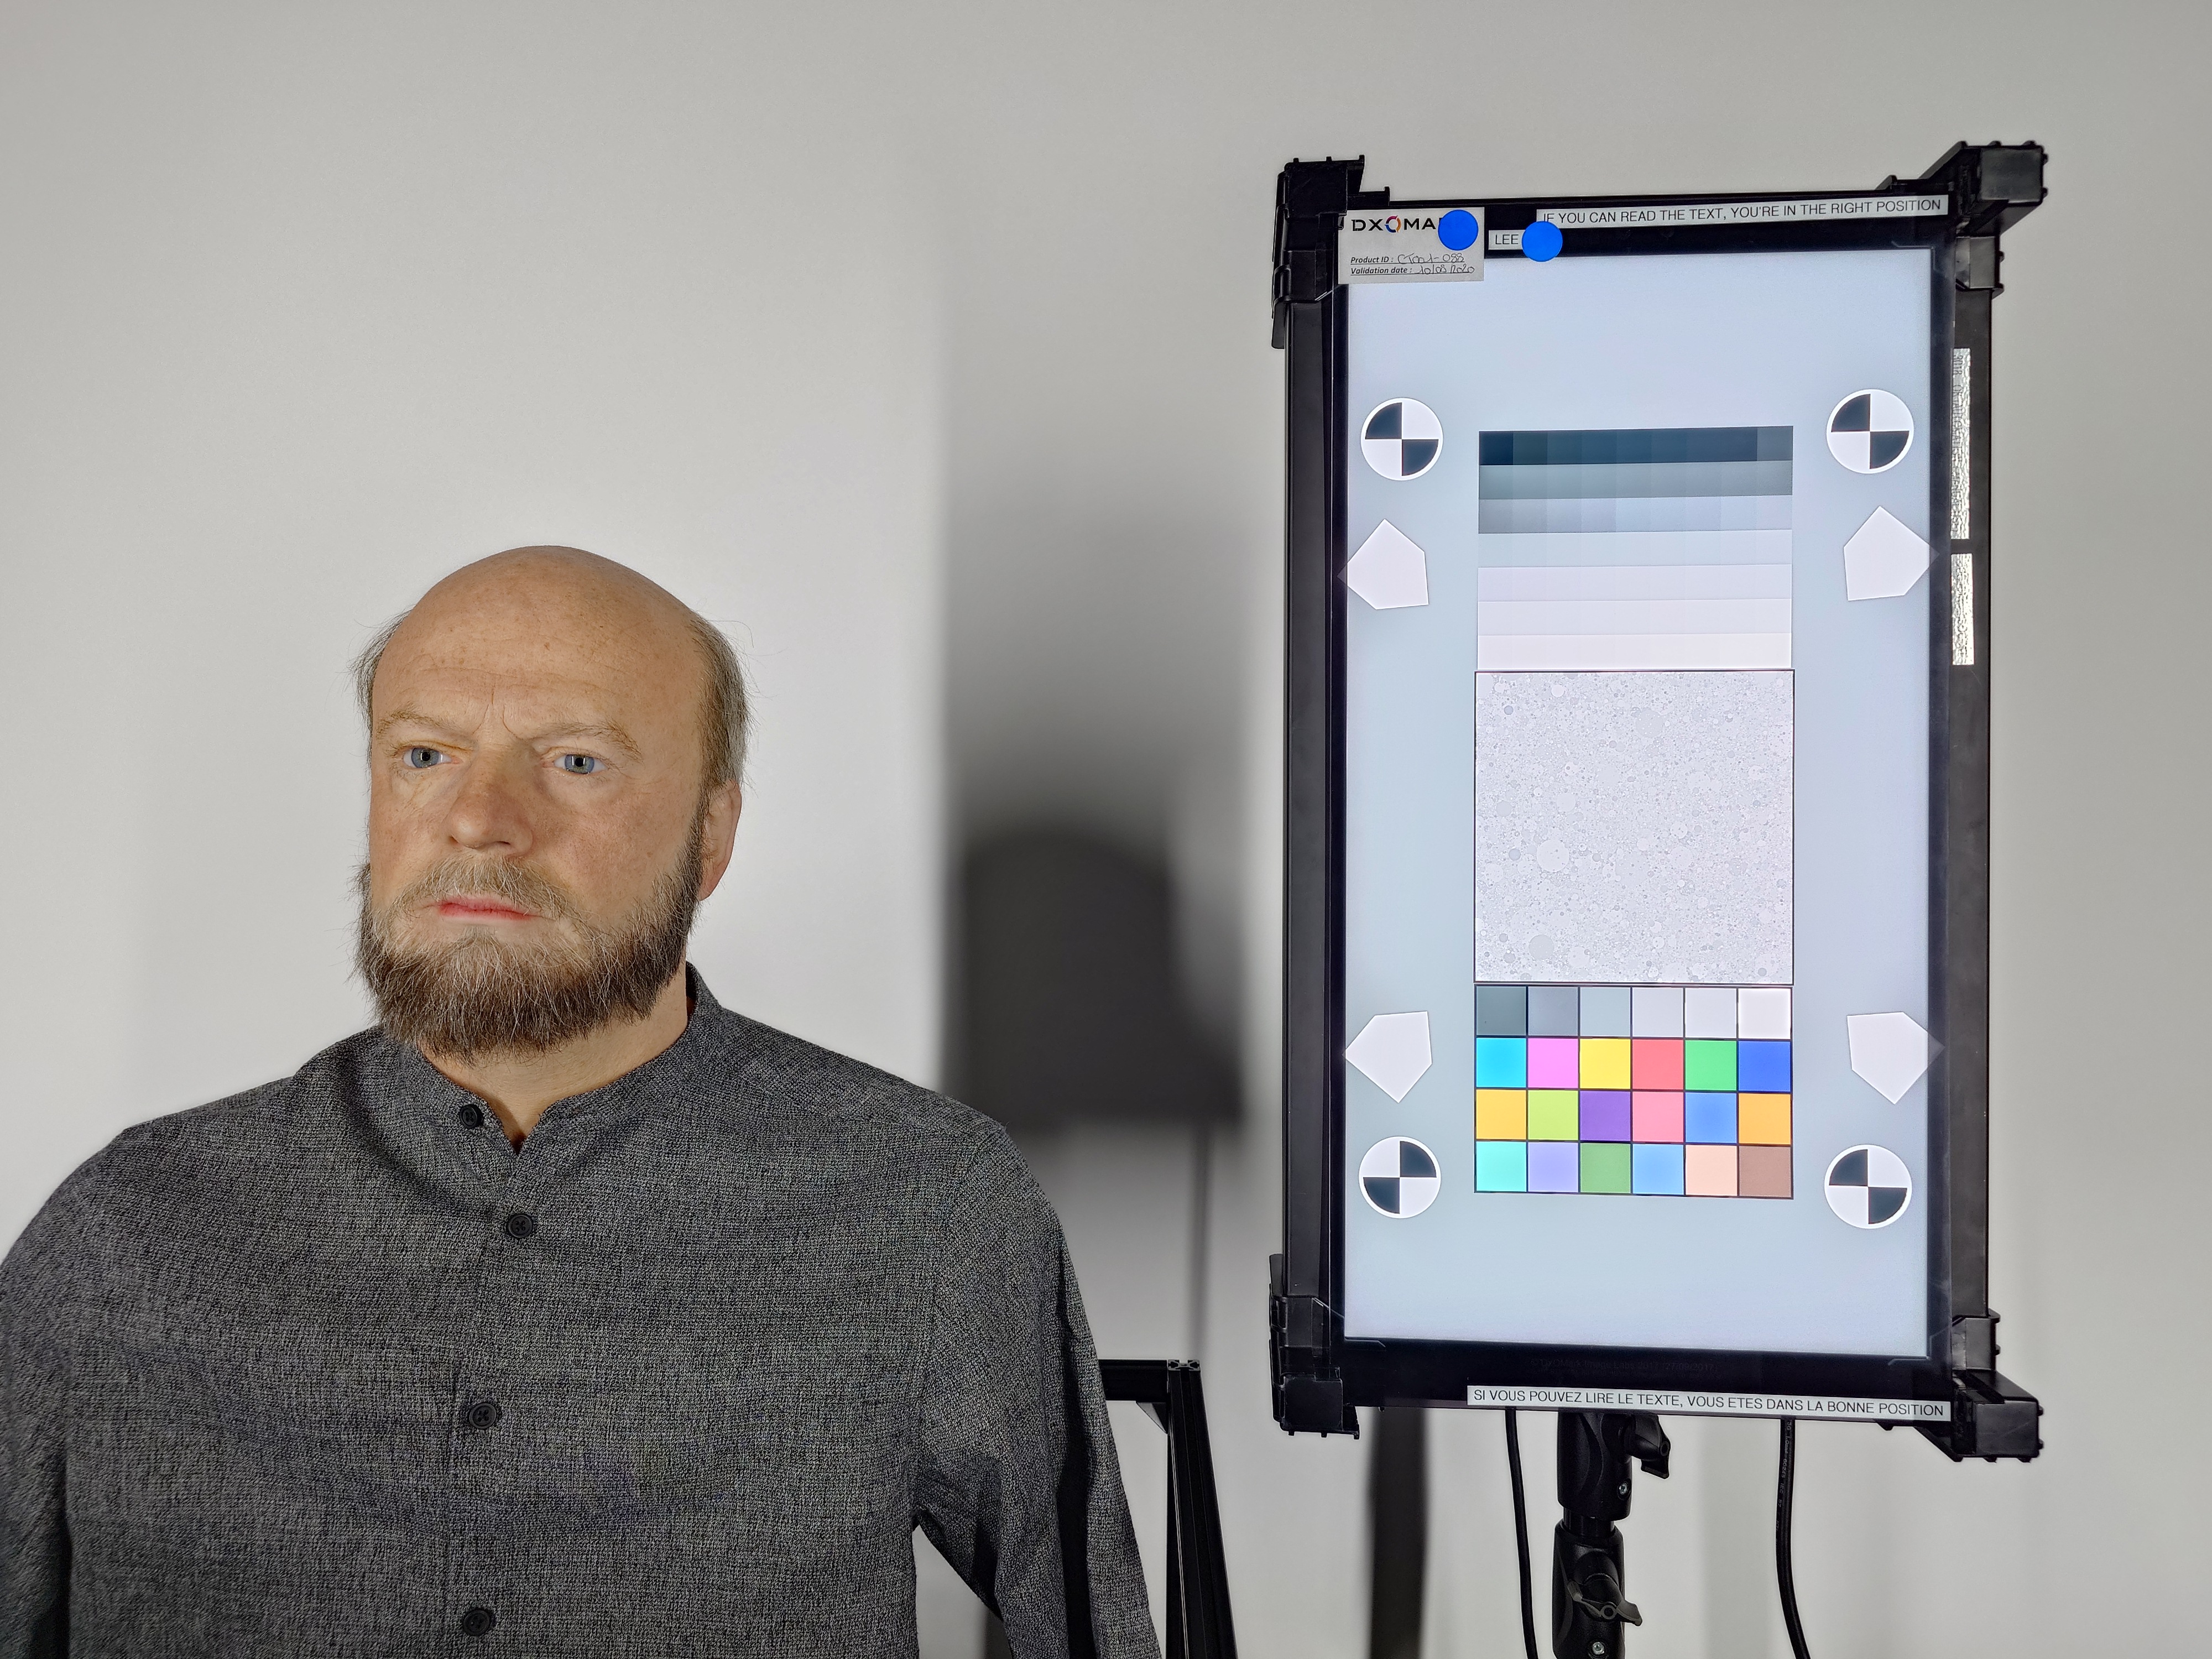
Preview
58
Apple iPhone 16 Pro
Apple iPhone 16 Pro
Preview tests analyze the image quality of the camera app's preview of the image, with particular attention paid to the difference between the capture and the preview, especially regarding dynamic range and the application of the bokeh effect. Also evaluated is the smoothness of the exposure, color and focus adaptation when zooming from the minimal to the maximal zoom factor available. The preview frame rate is measured using the LED Universal Timer.
Sony Xperia 5 V – Preview – Highlight clipping
Sony Xperia 5 V – Capture – Noticeably less pronounced clipping
Zoom
86
Xiaomi 15 Ultra
Xiaomi 15 Ultra
About DXOMARK Camera Zoom tests
DXOMARK engineers capture and evaluate over 400 test images in controlled lab environments and in outdoor, indoor, and low-light natural scenes, using the camera’s default settings and pinch zoom at various zoom factors from ultra wide to very long-range zoom. The evaluation is performed by visually inspecting the images against a reference of natural scenes, and by running objective measurements of chart mages captured in the lab under different conditions from 20 to 1000 lux and color temperatures from 2300K to 6500K.
Sony Xperia 5 V Zoom Scores
This graph illustrates the relative scores for the different zoom ranges evaluated. The abscissa is expressed in 35mm equivalent focal length. Zooming-in scores are displayed on the right and Zooming-out scores on the left.
82
Huawei Pura 70 Ultra
Huawei Pura 70 Ultra
These tests analyze the performance of the ultra-wide camera at several focal lengths from 12 mm to 20 mm. All image quality attributes are evaluated, with particular attention paid to such artifacts as chromatic aberrations, lens softness, and distortion. Pictures below are an extract of tested scenes.
Sony Xperia 5 V – Lack of detail, noise
57
Xiaomi 15 Ultra
Xiaomi 15 Ultra
All image quality attributes are evaluated at focal lengths from approximately 40 mm to 300 mm, with particular attention paid to texture and detail. The score is derived from a number of objective measurements in the lab and perceptual analysis of real-life images.
DXOMARK CHART (DMC) detail preservation score per focal length
This graph shows the evolution of the DMC detail preservation score with respect to the full-frame equivalent focal length for different light conditions. The x-axis represents the equivalent focal length measured for each corresponding shooting distance and the y-axis represents the maximum details preservation metric score: higher value means better quality. Large dots correspond to zoom ratio available in the user interface of the camera application.
Sony Xperia 5 V - Medium range tele
Sony Xperia 5 V - Low of detail, unnatural detail
Sony Xperia 5 IV - Medium range tele
Sony Xperia 5 IV - Better detail, thanks to dedicated tele camera module
Video
118
Apple iPhone 16 Pro
Apple iPhone 16 Pro
About DXOMARK Camera Video tests
DXOMARK engineers capture and evaluate more than 2.5 hours of video in controlled lab environments and in natural low-light, indoor and outdoor scenes, using the camera’s default settings. The evaluation consists of visually inspecting natural videos taken in various conditions and running objective measurements on videos of charts recorded in the lab under different conditions from 1 to 1000+ lux and color temperatures from 2,300K to 6,500K.
Sony Xperia 5 V Video scores
Video tests analyze the same image quality attributes as for still images, such as exposure, color, texture, or noise, in addition to temporal aspects such as speed, and smoothness and stability of exposure, white balance, and autofocus transitions.
86
Oppo Find X8 Pro
Oppo Find X8 Pro
86
Oppo Find X8 Pro
Oppo Find X8 Pro
Exposure tests evaluate the brightness of the main subject and the dynamic range, eg. the ability to render visible details in both bright and dark areas of the image. Stability and temporal adaption of the exposure are also analyzed.
Image-quality color analysis looks at color rendering, skin-tone rendering, white balance, color shading, stability of the white balance and its adaption when light is changing.
Sony Xperia 5 V – Orange color cast
Honor 90 – White balance instabilites
Samsung Galaxy A34 5G – Nice color rendering
93
Oppo Find X6 Pro
Oppo Find X6 Pro
Texture tests analyze the level of details and texture of the real-life videos as well as the videos of charts recorded in the lab. Natural videos recordings are visually evaluated, with particular attention paid to the level of details in the bright and areas as well as in the dark. Objective measurements are performed of images of charts taken in various conditions from 1 to 1000 lux. The charts used are the DXOMARK chart (DMC) and Dead Leaves chart.
DXOMARK CHART (DMC) detail preservation video score vs lux levels
This graph shows the evolution of the DMC detail preservation video score with the level of lux in video. DMC detail preservation score is derived from an AI-based metric trained to evaluate texture and details rendering on a selection of crops of our DXOMARK chart.
109
Apple iPhone 16 Pro
Apple iPhone 16 Pro
Noise tests analyze various attributes of noise such as intensity, chromaticity, grain, structure, temporal aspects on real-life video recording as well as videos of charts taken in the lab. Natural videos are visually evaluated, with particular attention paid to the noise in the dark areas and high dynamic range conditions. Objective measurements are performed on the videos of charts recorded in various conditions from 1 to 1000 lux. The chart used is the DXOMARK visual noise chart.
Spatial visual noise evolution with the illuminance level
This graph shows the evolution of spatial visual noise with the level of lux. Spatial visual noise is measured on the visual noise chart in the video noise setup. DXOMARK visual noise measurement is derived from ISO15739 standard.
Temporal visual noise evolution with the illuminance level
This graph shows the evolution of temporal visual noise with the level of lux. Temporal visual noise is measured on the visual noise chart in the video noise setup.
104
Apple iPhone 16 Pro
Apple iPhone 16 Pro
Stabilization evaluation tests the ability of the device to stabilize footage thanks to software or hardware technologies such as OIS, EIS, or any others means. The evaluation looks at residual motion, smoothness, jellow artifacts and residual motion blur on walk and run use cases in various lighting conditions. The video below is an extract from one of the tested scenes.
Sony Xperia 5 V –
Sharpness differences between frames, frame shift during running section
Honor 90 – Sharpness differences between frames
Samsung Galaxy A34 5G – Sharpness difference between frames, frame shift during running section, ghosting
82
Xiaomi 12S Ultra
Xiaomi 12S Ultra
Artifacts are evaluated with MTF and ringing measurements on the SFR chart in the lab as well as frame-rate measurements using the LED Universal Timer. Natural videos are visually evaluated by paying particular attention to artifacts such as aliasing, quantization, blocking, and hue shift, among others. The more severe and the more frequent the artifact, the higher the point deduction from the score. The main artifacts and corresponding point loss are listed below.
Main video artifacts penalties


DXOMARK encourages its readers to share comments on the articles. To read or post comments, Disqus cookies are required. Change your Cookies Preferences and read more about our Comment Policy.