We put the Huawei MateBook X Pro through our rigorous DXOMARK Laptop test suite to measure its performance in sound, camera and display. In this review, we will break down how it fared in a variety of tests and several common use cases.
Overview
Scoring
Use-case and feature subscores included in the calculations of the global score
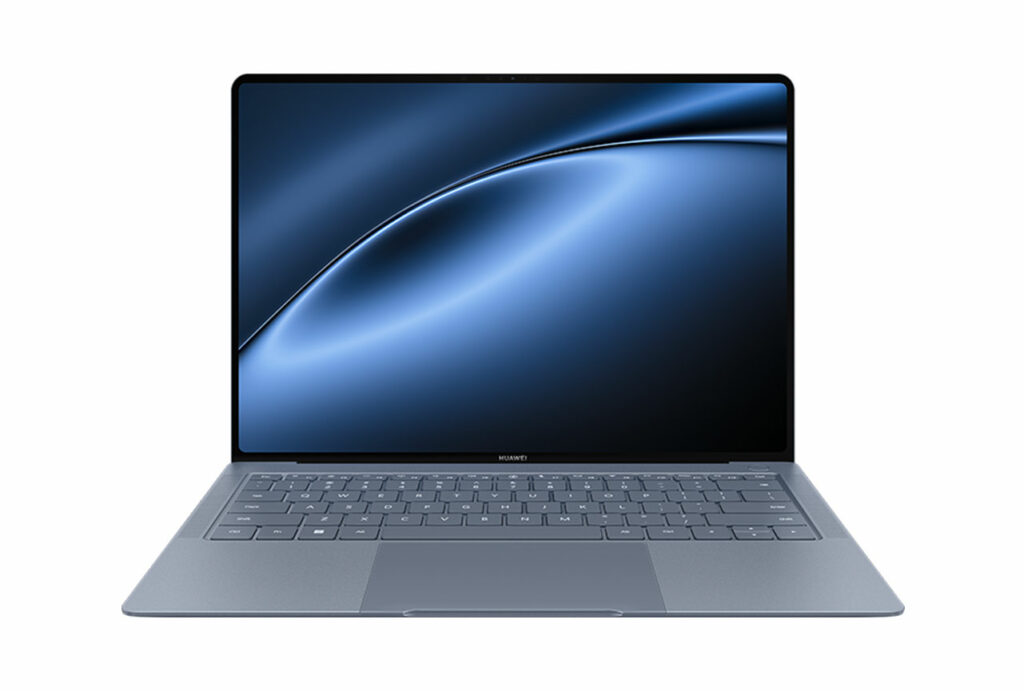
 Huawei MateBook X Pro 2024

94
camera
76
Apple MacBook Pro 14" (M3 Pro, 2023)
Best: Apple MacBook Pro 14" (M3 Pro, 2023) (93)
37
Lenovo ThinkPad X9 Aura
Best: Lenovo ThinkPad X9 Aura (56)
43
Microsoft Surface Laptop 13-inch
Best: Microsoft Surface Laptop 13-inch (79)
78
Apple MacBook Pro 14" (M5; 2025)
Best: Apple MacBook Pro 14" (M5; 2025) (85)
146
display
81
Apple MacBook Pro 14" (M3 Pro, 2023)
Best: Apple MacBook Pro 14" (M3 Pro, 2023) (84)
83
Apple MacBook Pro 14" (M3 Pro, 2023)
Best: Apple MacBook Pro 14" (M3 Pro, 2023) (95)
77
Honor MagicBook View 14 (2022)
Best: Honor MagicBook View 14 (2022) (84)
150
audio
141
Apple MacBook Pro 14" (M2 Pro, 2023)
Best: Apple MacBook Pro 14" (M2 Pro, 2023) (149)
131
Acer Swift Go 14
Best: Acer Swift Go 14 (133)
143
Asus Zenbook 14X OLED (2023)
Best: Asus Zenbook 14X OLED (2023) (153)
Pros
- Generally good face exposure
- Subjects are always in focus
- Good level of details in bright light conditions
Cons
- Colors and skin tones are desaturated
- Exposure instabilities are visible when the subject is in motion
- Noise is visible and details are lost in low-light conditions
- Dynamic range is slightly low on contrasted scenes
Test summary
About DXOMARK Laptop tests: For scoring and analysis in our laptop reviews, DXOMARK engineers perform a variety of objective tests and undertake more than 20 hours of perceptual evaluations under controlled lab conditions and real-life scenarios. (For more details about the Laptop protocol, click here.)
The following section gathers key elements of our exhaustive tests and analyses performed in DXOMARK laboratories. Detailed performance evaluations in the form of reports are available upon request. Do not hesitate to contact us.
Camera
94
Huawei MateBook X Pro 2024
136
Apple MacBook Pro 14" (M4, 2024)
Apple MacBook Pro 14" (M4, 2024)
About DXOMARK Camera Laptop tests
DXOMARK evaluates the image quality of the built in camera during video calls, whether with a single person or with multiple people, in a variety of lighting conditions. Our camera evaluation particularly assesses the ability of the built-in camera to clearly render human faces during video calls. Other intrinsic camera quality aspects are also evaluated, like color reproduction, texture and noise, as well as artefacts.
The Huawei MateBook X Pro 2024 generally offers good face exposure, while keeping the subject in focus in most conditions. Dynamic range is slightly limited, leading to some loss of details in bright or dark parts, even with low contrasted scenes. Additionally, when the subject is moving, some exposure instabilities can be visible. Color rendering and skin tones, however, are often desaturated. In bright conditions, the texture-noise tradeoff is good, with a high level of details. But in low-light conditions, noise can be visible.
The following chart presents the camera subscores for the video call use case:
Camera texture acutance on Deadleaves with illuminance levels
This graph shows the evolution of texture acutance with the level of lux measured on a Deadleaves chart.
The following graphs show the objective measurements performed in our camera labs:
Camera visual noise evolution with illuminance levels
This graph shows the evolution of spatial visual noise with the level of lux. Spatial visual noise is measured on the visual noise chart in the video noise setup. DXOMARK visual noise measurement is derived from ISO15739 standard.
Target exposure on face with illuminance levels
These measurements take place on a setup combining realistic mannequins and a backlit panel simulating high dynamic range conditions. This graph shows the evolution of lightness measured on the forehead of the realistic mannequin with the level of lux, for multiple lighting conditions. The lightness is measured in L*. Delta EV specifies the difference of luminance in stops between the face and the light panel simulating HDR conditions.
Target exposure on face with illuminance levels in HDR conditions
These measurements take place on a setup combining realistic mannequins and a backlit panel simulating high dynamic range conditions. This graph shows the evolution of lightness measured on the forehead of the realistic mannequin with the level of lux, for multiple lighting conditions. The lightness is measured in L*. Delta EV specifies the difference of luminance in stops between the face and the light panel simulating HDR conditions.
Display
146
Huawei MateBook X Pro 2024
156
Apple MacBook Pro 14" (M3 Pro, 2023)
Apple MacBook Pro 14" (M3 Pro, 2023)
About DXOMARK DisplayLaptop tests
Through objective testing, DXOMARK evaluates the display performance by looking at 3 main aspects: Readability, HDR & SDR performances. While evaluating readability, our engineers will particularly focus on screen brightness, contrast, and reflectance, assessing the ease and comfort of viewing displayed images indoors. We also evaluate HDR & SDR performance while looking at video contents, verifying that the display rendering respects the original artistic intent of the filmmaker
The Huawei display’s antireflective coating and brightness range make it a versatile and suitable device to use in various lighting conditions, ranging from low to bright light.
With an HDR peak luminance level that is stronger than most competitors, the Matebook X Pro was able to provide realistic highlights to the displayed content. The only drawback to the high HDR peak luminance was that if the screen reached its maximum brightness level, some HDR clipping, or loss of details, would occur.
Although the screen’s brightness was a plus, its color rendering was only mildly accurate.
The precisely calibrated SDR and HDR tonemapping respected the tones and local contrasts of videos, providing a pleasant viewing experience.
The display maintained an even brightness uniformity at nearly all levels, except at minimum brightness, which was to be expected considering that the X Pro’s display can go as low as 2 nits.
The following chart presents the display subscores:
Display scores comparison
The following graphs show the objective measurements performed in our display lab:
Gamut coverage for video content
The primary colors are measured both in HDR10 and SDR. The solid color gamut measures the extent of the color area that the device can render in total darkness. The dotted line represents the content’s artistic intent. The measured gamut should match the master color space of each video.
Display reflectance measurement (SCI)
Measurements above show the reflection of the device within the visible spectrum range (400 nm to 700 nm). It includes both diffuse and specular reflection.
Display reflectance profile
Display brightness uniformity
0.066
cd/m²
0.054
cd/m²
0.064
cd/m²
0.06
cd/m²
0.05
cd/m²
0.057
cd/m²
0.059
cd/m²
0.05
cd/m²
0.053
cd/m²
 Distribution of brightness (min)
576.1
cd/m²
562.9
cd/m²
570.9
cd/m²
571.3
cd/m²
561.8
cd/m²
570
cd/m²
585.1
cd/m²
589.4
cd/m²
588.7
cd/m²
Distribution of brightness (max)
This illustration shows the brightness measured on nine zones of the display for minimum brightness (left) and maximum brightness (right) for SDR content.
Display SDR EOTF measurement
This graph represents the rendering of contrast (gray levels) for SDR video content, measured in the dark. We expect to be close to the 2.2 or 2.4 gamma references.
Display peak brightness for video contents
White point color
This graph represents the color temperature of white content, compared with the reference (Daylight illuminant D65) measured in the dark on video at minimum and maximum brightness.
Audio
150
Huawei MateBook X Pro 2024

Highest Score
About DXOMARK Audio Laptop tests
Combining objective and perceptual testing in our labs and in real life conditions, DXOMARK evaluates the audio performance on two main use cases: video call and music & video. On video call, our engineers look at the quality of the audio playback and capture, and particularly the intelligibility of speaker’s voices. One specific aspect that is also evaluated is the duplex performance, in situations where more than one person is talking, making sure that there’s no echo or gating and that necessary sounds are not lost.
The laptop’s overall audio quality earned it a top score in this feature.
During video calls, voice quality was natural-sounding thanks to good tonal balance. The overall envelope was well-defined, offering a natural sound. Background noise was effectively reduced, and SNR quality enhanced the clarity of music and speech.
The device’s handling of multiple speakers during a video call was overall decent, despite some gating, although speech remained intelligible.
The device featured some excellent qualities for multimedia playback, with a natural and pleasant tonal playback. The device’s bass rendition really stood out for a laptop. With its wide stereo rendition, distinct audio sources were easily localizable, with realistic distance rendition.
The following chart presents the capture subscores for the video call use case:
Audio capture scores comparison
The following graphs show the frequency response, distortion and directivity in capture, recorded in our semi-anechoic room:
Audio capture frequency response
A 1/12 octave frequency response graph, which measures the volume of each frequency captured by the laptop when recording an objective test signal at 1 meter in an anechoic environment.
Audio capture Total Harmonic Distortion + Noise
This graph shows the Total Harmonic Distortion and Noise over the hearable frequency range. It represents the distortion and noise of the device capturing our test signal.
Audio capture directivity
Directivity graph of the laptop microphone(s) when capturing test signals using the camera app. It represents the acoustic energy (in dB) over the angle of incidence of the sound source (normalized to the angle 0°, in front of the device).
The following chart presents the playback for the multimedia use case:
Audio playback scores comparison
The following graphs show the frequency response, distortion and directivity in multimedia playback, recorded in our semi-anechoic room:
Audio playback frequency response
A 1/12 octave frequency response graph, which measures the volume of each frequency emitted by the laptop when playing a pure-sine wave in an anechoic environment.
Audio playback Total Harmonic Distortion + Noise