For our DxOMark lens reviews, we evaluate the performance of interchangeable lenses for cameras equipped with sensors that can capture images in RAW format. In this article, we explain how we test for different criteria in the DxOMark image quality test lab and how the test results translate into sub-scores and the final DxOMark lens score.
For our testing, we mount lenses on cameras and measure them for the following criteria:
- Resolution, derived from the MTF (Modulation Transfer Function) measurement
- Distortion and Chromatic aberrations
- Vignetting
- Light transmission (T-stop)
The DxOMark Score for lenses
We use the sub-scores for the criteria above to compute the final DxOMark lens score. The score shows the amount of information captured by the lens on a given camera and how well the camera and lens perform together. However, the score does not reflect the intrinsic quality of the camera sensor.
- The DxOMark Lens Score corresponds to an average of the optimal quantity of information that the camera can capture for each focal length.The quantity of information is calculated for each focal length/aperture combination and the highest values for each focal length are weighted to compute the score.
- The DxOMark Lens Score is based on low-light conditions (150 lux and 1/60s exposure time). We chose these light conditions because we believe low-light performance is very important in photography today, and because photographers need to know how well lenses perform at their widest aperture. Lenses with a high f-number tend to be expensive and photographers want to know if the performance is worth the additional expense. The score does not account for depth of field and only takes into account lens performance at perfect focus.
- The DxOMark Lens Score is a linear scale related to the largest print size that provides excellent image quality. Doubling the size of the print requires doubling the DxOMark score. A score difference of less than 10% can be considered irrelevant.
- The DxOMark Lens Score is an open scale, limited by the lens and camera resolution and by sensor noise. As we can expect these to improve over time, the maximum DxOMark score is bound to increase with technological development.
You can read more about why we base our testing on the RAW image format here. But now let’s have a closer look at the setups and methodologies for the individual test criteria and how the sub-scores that feed into the final score are computed.
MTF and sharpness
The Modulation Transfer Function (MTF) of a camera (body and lens) is measured in line with the ISO 12233 standard SFR method (see MTF measurement definition). The target is a pattern of white and black squares tilted at a 5° angle and filling the field of the camera. DxO Labs designed the target and produced it using a high-resolution printer to achieve sharp transitions between black and white areas without aliasing. The target is attached to a frame made with aluminum profiles to provide the necessary rigidity to the target assembly.
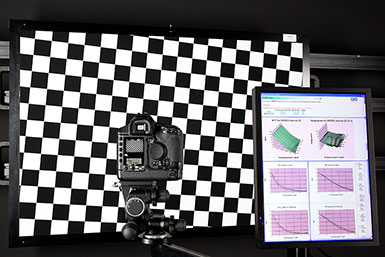
To guarantee absolute stability and prevent any motion blur, the camera is mounted on a geared tripod head that is fixed to a heavy-duty studio stand. A graduated rail on ball bearings permits very accurate adjustment of the distance between camera and target. To minimize vibrations, we use the reflex mirror lockup function when available and we release the shutter with a remote control or the self-timer. Before shooting, we ensure that the camera sensor and target planes are parallel by using a mirror placed flush against the target. Perfect alignment is achieved when the reflected image of the lens appears at the center of the camera viewfinder.
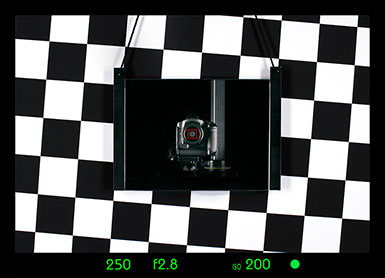
We select the lowest actual ISO speed of the camera to acquire images with a minimum level of noise. We set the exposure so that the white squares of the target are just below sensor saturation in RAW format, to ensure that the entire dynamic of the sensor is used. Of course, we deactivate all sharpening options and stabilizing systems of the camera or lens. For each focal length and aperture of the lens, we take pictures at 60 different focusing positions around the focusing point set by the camera’s autofocus system. We then use the sharpest image to measure the camera’s MTF.
We use these results to generate the DxOMark resolution score. The score represents the sharpness performance of a lens-camera combination averaged over its entire focal length and aperture ranges and is computed as follows:
For each focal length and each f-number sharpness is computed and weighted across the image field, with the corners being less critical than the image center. This results in a number for each focal length / aperture combination. We then choose the maximum sharpness value from the aperture range for each focal length. These values are then averaged across all focal lengths to obtain the DxOMark resolution score that is reported in P-MPix (Perceptual Megapixels).
It’s worth noting that for lenses with a wide zoom range the differences between sharpness at different focal lengths can be quite significant. For most lenses, sharpness in P-Mpix is typically between 50% and 100% of the sensor pixel count, and differences smaller than 1 P-MPix are usually not noticeable. The best resolutions are usually achieved by prime lenses at apertures between f/2.8 and f/8.
Distortion, LCA, and vignetting
We measure lateral chromatic aberration (LCA) and distortion on the DxO Labs dot chart, which is a pattern of regularly distributed black dots on a glass support. (We chose glass because of its flatness and shape stability.) The dots printed on the chart are circular and perfectly aligned to form a grid.
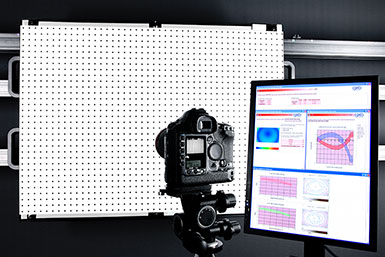
We measure vignetting using the white background of the same dot chart. Before shooting, we align the camera sensor on the target plane and check the uniformity of the lighting to ensure it remains within +/-4% limits. To increase the accuracy of the vignetting measurement, we use a calibrated camera-lens combination to characterize the actual illumination uniformity of the chart. We set the color temperature to 5500K (corresponding to daylight).
We take a picture at each focal length and aperture. The camera remains at the same shooting distance to frame the same chart area, which means that the illumination of the chart is identical for every focal length and aperture. Finally, we record two additional exposures at each focal length and at two different target distances. For those shots, we focus the lens at infinity in order to calculate the Effective Focal length (EFL).
We average the absolute value of the maximal distortion across the range of focal lengths to compute the DxOMark distortion score (distortion being independent from aperture). Zoom lenses tend to have negative (barrel) distortion for short focal lengths, and positive (pincushion) distortion for longer focal lengths. Our score penalizes both types of distortion. Distortion is expressed as a percentage, with zero being the perfect case, and 1% being high. However, there is no upper limit. A value of 0.2% would indicate noticeable distortion. It’s also worth pointing out that wide-angle lenses typically have more distortion than longer lenses.
To calculate the chromatic aberration score, we first normalize the measured values (scale on a 24x36mm sensor) and weight them across the image field for each focal length and aperture. Small amounts of aberration in the image corners are tolerated. For each focal length, we select the largest aberration value in the aperture range and then average them over all focal lengths to compute the final DxOMark chromatic aberration score. Chromatic aberrations are expressed in micrometers (µm). The perfect value is 0; a value of 30 would be very high, but there is no upper limit. A value of 5µm is noticeable and represents about 1 pixel for most cameras.
We take into account only the widest possible aperture when calculating the DxOMark vignetting score. We weight the values across the image field, with more tolerance for vignetting in the far corners. We then average the single values for each focal length to generate the final DxOMark vignetting score. Vignetting is expressed in Exposure Value (EV) and is a negative number, as it describes a loss of exposure. No vignetting at all (0 EV) is perfect. Very wide-aperture lenses are likely to show more vignetting (often higher than 2EV). Variations below 1/3 EV are barely noticeable.
Light transmission
The photometric aperture, also known as “T-stop” (T = transmission), is the aperture of the lens corrected for its transmission loss (see light transmission definition). To measure light transmission, we take a picture of a uniformly illuminated (+/-1%) opalescent transmission target.
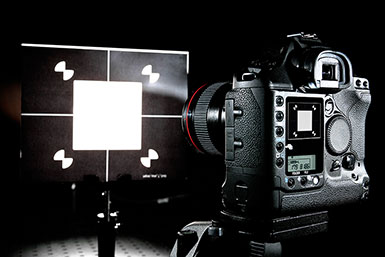
We chose the light source for its remarkable stability. It is exactly the same source as for our ISO speed measurement: A halogen lamp filtered to achieve a daylight color temperature of 5500K. This is worth noting because we use ISO sensitivity values in the T-stop calculation. We measure the luminance of the diffusing surface (about 140 cd/m²) with a certified luminance-meter. Knowing the entrance light flux, the sensor response, and the shutter speed, we can then calculate the T-stop of the lens for a given focusing distance.
We place the camera at a distance equal to 40 times the focal length of the lens (for example 2 meters for a 50mm lens). We take one picture for each aperture of the lens using full-stop increments.
To compute the transmission score, we measure the T-stop at the largest possible aperture iat each focal length. We then average those values over the range of focal lengths to calculate the final score. T-stops are very similar to the lens f-stops in that smaller numbers mean more light and prime lenses achieve the best transmission. Zoom lenses cannot usually have very large apertures at long focal lengths. T-stops have an indirect impact on image quality as they will usually change the camera’s auto exposure. A low-transmission lens can require longer exposure times, and potentially motion blur, or a higher ISO sensitivity, and higher noise levels, than a high-transmission lens. Variations below 10% are not noticeable.


