We put the Asus Zenfone 11 Ultra through our rigorous DXOMARK Display test suite to measure its performance across four criteria. In this test results, we will break down how it fared in a variety of tests and several common use cases.
Overview
Key display specifications
- 6.78-inch OLED
- Dimensions: 163.8 x 76.8 x 8.9 mm (6.45 x 3.02 x 0.35 inches)
- Resolution: 1800 x 2400 pixels, (~388 ppi density)
- Aspect ratio: 20:9
- Refresh rate: 144 Hz
Scoring
Sub-scores and attributes included in the calculations of the global score.
 Asus Zenfone 11 Ultra

143
display
142
Samsung Galaxy S24 Ultra
Best: Samsung Galaxy S24 Ultra (164)
148
Google Pixel 8
Best: Google Pixel 8 (165)
143
Samsung Galaxy S25 Ultra
Best: Samsung Galaxy S25 Ultra (167)
135
Google Pixel 7 Pro
Best: Google Pixel 7 Pro (164)
Position in Global Ranking

46
th
1. Samsung Galaxy S25 Ultra
160
8. Samsung Galaxy S24 Ultra
155
9. Samsung Galaxy Z Fold6
154
9. Samsung Galaxy S24+ (Exynos)
154
9. Samsung Galaxy S24 (Exynos)
154
16. Google Pixel 9 Pro Fold
152
17. Apple iPhone 15 Pro Max
151
22. Apple iPhone 16 Pro Max
150
22. Samsung Galaxy Z Flip6
150
29. Samsung Galaxy S23 Ultra
148
35. Samsung Galaxy A55 5G
147
38. Apple iPhone 14 Pro Max
146
40. Samsung Galaxy S24 FE
145
44. Samsung Galaxy Z Flip5
144
46. Asus Zenfone 11 Ultra
143
46. Samsung Galaxy A35 5G
143
51. Apple iPhone 13 Pro Max
142
51. Samsung Galaxy Z Fold5
142
57. Samsung Galaxy S23 FE
140
62. Xiaomi Redmi Note 14 Pro+ 5G
139
63. Honor Magic4 Ultimate
138
74. Samsung Galaxy S22 Ultra (Snapdragon)
135
74. Xiaomi Redmi Note 13 Pro Plus 5G
135
79. Samsung Galaxy S22+ (Exynos)
134
82. Samsung Galaxy Z Flip4
133
82. Samsung Galaxy S22 Ultra (Exynos)
133
82. Samsung Galaxy S22 (Snapdragon)
133
82. Vivo X80 Pro (MediaTek)
133
87. Samsung Galaxy S22 (Exynos)
132
92. Samsung Galaxy S21 Ultra 5G (Exynos)
131
92. Vivo X80 Pro (Snapdragon)
131
96. Samsung Galaxy Z Fold4
130
96. Samsung Galaxy S21 Ultra 5G (Snapdragon)
130
96. Samsung Galaxy S21 FE 5G (Snapdragon)
130
107. Samsung Galaxy A54 5G
129
111. Apple iPhone 12 Pro Max
127
115. Vivo X60 Pro 5G (Snapdragon)
126
132. Motorola Edge 30 Pro
123
136. Apple iPhone 11 Pro Max
122
136. Motorola Edge 40 Pro
122
140. Apple iPhone SE (2022)
120
146. Samsung Galaxy A52 5G
114
148. Motorola Razr 40 Ultra
113
151. Crosscall Stellar-X5
109
152. Samsung Galaxy A53 5G
108
156. Crosscall Stellar-M6
101
159. Samsung Galaxy A22 5G
82
Position in Ultra-Premium Ranking
35
th
1. Samsung Galaxy S25 Ultra
160
6. Samsung Galaxy S24 Ultra
155
7. Samsung Galaxy Z Fold6
154
7. Samsung Galaxy S24+ (Exynos)
154
12. Google Pixel 9 Pro Fold
152
13. Apple iPhone 15 Pro Max
151
17. Apple iPhone 16 Pro Max
150
17. Samsung Galaxy Z Flip6
150
22. Samsung Galaxy S23 Ultra
148
29. Apple iPhone 14 Pro Max
146
33. Samsung Galaxy Z Flip5
144
35. Asus Zenfone 11 Ultra
143
38. Apple iPhone 13 Pro Max
142
38. Samsung Galaxy Z Fold5
142
44. Honor Magic4 Ultimate
138
51. Samsung Galaxy S22 Ultra (Snapdragon)
135
53. Samsung Galaxy S22+ (Exynos)
134
55. Samsung Galaxy Z Flip4
133
55. Samsung Galaxy S22 Ultra (Exynos)
133
55. Vivo X80 Pro (MediaTek)
133
62. Samsung Galaxy S21 Ultra 5G (Exynos)
131
62. Vivo X80 Pro (Snapdragon)
131
66. Samsung Galaxy Z Fold4
130
66. Samsung Galaxy S21 Ultra 5G (Snapdragon)
130
74. Apple iPhone 12 Pro Max
127
87. Apple iPhone 11 Pro Max
122
89. Motorola Razr 40 Ultra
113
Pros
- Good brightness in indoor conditions
- Smooth display in all use cases
- Uniform screen brightness
Cons
- Screen is too bright in low-light conditions
- Screen is slightly too bright when watching HDR10 videos in low light
- Long time from touch to response, and unwanted touches
The Asus Zenfone 11 Ultra display showed a solid performance in our testing, with scores that were well-balanced across the attributes.
The device showed good brightness under sunlight, making the screen very readable in challenging conditions, even though there was some lack of contrast in the darkest shades. On its website, Asus claims a peak brightness of 2,500 nits to ensure “easy readability even under direct sunlight” although our tests under intense lighting conditions measured peak brightness at 2320 nits.
In indoor conditions, the Zenfone 11 Ultra’s screen luminance was slightly higher than that of its competitors.
The Zenfone 11 Ultra’s screen colors were rendered naturally when tested in the Natural Mode for Display-P3 content and Standard Mode for sRGB content.
The device provided an overall good experience watching HDR10 videos, with well-managed frame drops and sufficient brightness in most conditions except low light, when luminance was slightly too bright. However, our experts noticed that the color highlights were desaturated on specific content, which was particularly noticeable on blue colors. (Read more about this in the video section.)
Test summary
About DXOMARK Display tests: For scoring and analysis, a device undergoes a series of objective and perceptual tests in controlled lab and real-life conditions. The DXOMARK Display score takes into account the overall user experience the screen provides, considering the hardware capacity and the software tuning. In testing, only factory-installed video and photo apps are used. More in-depth details about how DXOMARK tests displays are available in the article “A closer look at DXOMARK Display testing.”
The following section focuses on the key elements of our exhaustive tests and analyses performed in DXOMARK laboratories. Full reports with detailed performance evaluations are available upon request. To order a copy, please contact us.
Readability
142
Samsung Galaxy S24 Ultra
Samsung Galaxy S24 Ultra
How Display Readability score is composed
Readability evaluates the user’s ease and comfort of viewing still content, such as photos or a web page, on the display under different lighting conditions. Our measurements run in the labs are completed by perceptual testing and analysis.
Luminance under various lighting conditions
This graph shows the screen luminance in environments that range from total darkness to outdoor conditions. In our labs, the indoor environment (250 lux to 830 lux) simulates the artificial and natural lighting conditions commonly seen in homes (with medium diffusion); the outdoor environment (from 20,000 lux) replicates a situation with highly diffused light.
Contrast under various lighting conditions
This graph shows the screen’s contrast levels in lighting environments that range from total darkness to outdoor conditions. In our labs, the indoor environment (250 lux to 830 lux) simulates the artificial and natural lighting conditions commonly seen in homes (with medium diffusion); the outdoor environment (from 20,000 lux) replicates a situation with highly diffused light.
Photo EOTF
The Electro-Optical Transfer Function (EOTF) defines how bits are converted into luminance out of the display. Gray levels (horizontal axis) represent the different shades from pure white (100% gray level) to pitch black (0% gray level). The standard for still images follows a 2.2 gamma. The flatter the curves, the harder it is to perceive differences between consecutive shades. This phenomenon is more frequent under intensive lighting conditions (20,000 lux) in the low gray level regions.
Luminance vs Viewing Angle
This graph presents how the luminance drops as viewing angles increase.
Skin-tone rendering in an indoor (1000 lux) environment
From left to right: Asus Zenfone 11 Ultra, Honor Magic6 Pro, Apple iPhone 15 Pro Max, Huawei Mate 60 Pro
(Photos for illustration only)
Skin-tone rendering in a sunlight (>90 000 lux) environment
From left to right: Asus Zenfone 11 Ultra, Honor Magic6 Pro, Apple iPhone 15 Pro Max, Huawei Mate 60 Pro
(Photos for illustration only)
Average Reflectance (SCI) Asus Zenfone 11 Ultra
Asus Zenfone 11 Ultra
Honor Magic6 Pro
Apple iPhone 15 Pro Max
Huawei Mate 60 Pro
SCI stands for Specular Component Included, which measures both the diffuse reflection and the specular reflection. Reflection from a simple glass sheet is around 4%, while it reaches about 6% for a plastic sheet. Although smartphones’ first surface is made of glass, their total reflection (without coating) is usually around 5% due to multiple reflections created by the complex optical stack.
Average reflectance is computed based on the spectral reflectance in the visible spectrum range (see graph below) and human spectral sensitivity.
Reflectance (SCI)
Wavelength (horizontal axis) defines light color, but also our capacity to see it; for example, UV is a very low wavelength that the human eye cannot see; Infrared is a high wavelength that the human eye also cannot see). White light is composed of all wavelengths between 400 nm and 700 nm, i.e. the range the human eye can see. Measurements above show the reflection of the devices within the visible spectrum range (400 nm to 700 nm).
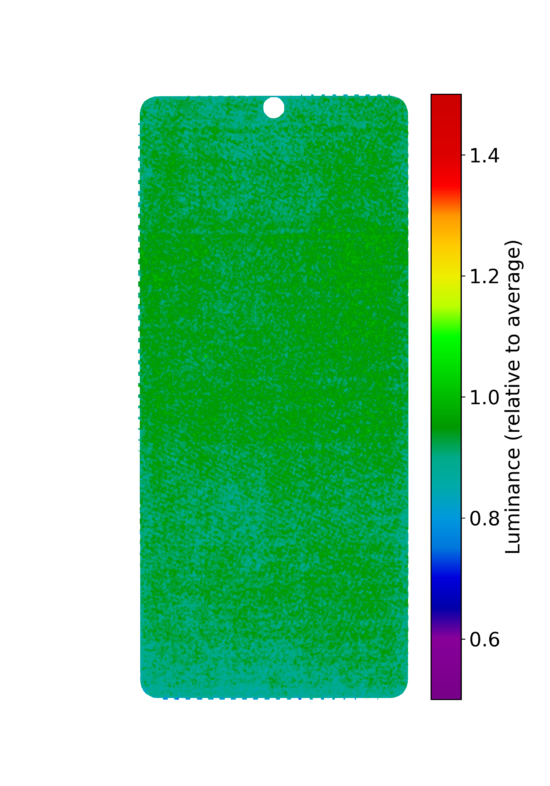
Uniformity
This graph shows the distribution of luminance throughout the entire display panel. Uniformity is measured with a 20% gray pattern, with bright green indicating ideal luminance. An evenly spread-out bright green color on the screen indicates that the display’s brightness is uniform. Other colors indicate a loss of uniformity.
PWM Frequency Asus Zenfone 11 Ultra
480 Hz
Bad
Good
Bad
Great
Asus Zenfone 11 Ultra
Honor Magic6 Pro
Apple iPhone 15 Pro Max
Huawei Mate 60 Pro
Pulse width modulation is a modulation technique that generates variable-width pulses to represent the amplitude of an analog input signal. This measurement is important for comfort because flickering at low frequencies can be perceived by some individuals, and in the most extreme cases, can induce seizures. Some experiments show that discomfort can appear at a higher frequency. A high PWM frequency (>1500 Hz) tends to be less disturbing for users.
Temporal Light Modulation
This graph represents the frequencies of lighting variation; the highest peak gives the most important modulation. The combination of a low frequency and a high peak is susceptible to inducing eye fatigue.
Color
148
Google Pixel 8
Google Pixel 8
How Display Color score is composed
Color evaluations are performed in different lighting conditions to see how well the device manages color with the surrounding environment. Devices are tested with sRGB and Display-P3 image patterns. Both faithful mode and default mode are used for our evaluation. Our measurements run in the labs are completed by perceptual testing & analysis.
White point color under D65 illuminant at 830 lux
This graph shows the white point coordinates for the image pattern using the default or the faithful mode. D65 illuminant (6500 Kelvin) is a standard that defines the color of white at midday; it is used for display calibration as a white reference, therefore devices are expected to be at or close to the D65 white point.
Color fidelity
Each arrow represents the color difference between a target color pattern (base of the arrow) and its actual measurement (tip of the arrow). The longer the arrow, the more visible the color difference is. If the arrow stays within the circle, the color difference will be visible only to trained eyes. The tested color mode is the most faithful proposed by each device, and a color correction is applied to account for the different white points of each device.
White color shift with angle
This graph shows the color shift when the screen is at an angle. Each dot represents a measurement at a particular angle. Dots inside the inner circle exhibit no color shift in angle; those between the inner and outer circle have shifts that only trained experts will see; but those falling outside the outer circle are noticeable.
Circadian Action Factor Asus Zenfone 11 Ultra
Asus Zenfone 11 Ultra
Honor Magic6 Pro
Apple iPhone 15 Pro Max
Huawei Mate 60 Pro
The circadian action factor is a metric that defines how light impacts the human sleep cycle. It is the ratio of the light energy contributing to sleep disturbances (centered around 450 nm, representing blue light) over the light energy contributing to our perception (covering 400 nm to 700 nm and centered on 550 nm, which is green light). A high circadian action factor means that the ambient light contains strong blue-light energy and is likely to affect the body’s sleep cycle, while a low circadian action factor implies the light has weak blue-light energy and is less likely to affect sleeping patterns.
Spectrum of white emission with Night mode ON
Spectrum measurements of a white web page with BLF mode on and off. This graph shows the impact of blue light filtering on the whole spectrum. All other settings used are default, in particular, the luminance level follows the auto-brightness adaptation from the manufacturer.
The wavelength (horizontal axis) defines light color but also the capacity to see it. For example, UV, which has a very low wavelength, and infra-red, which has a high wavelength, are both not visible to the human eye. White light is composed of all wavelengths between 400 nm and 700 nm, which is the range visible to the human eye.
Spectrum of white emission with Night mode OFF
Spectrum measurements of a white web page with BLF mode on and off. This graph shows the impact of blue light filtering on the whole spectrum. All other settings used are default, in particular, the luminance level follows the auto-brightness adaptation from the manufacturer.
The wavelength (horizontal axis) defines light color but also the capacity to see it. For example, UV, which has a very low wavelength, and infra-red, which has a high wavelength, are both not visible to the human eye. White light is composed of all wavelengths between 400 nm and 700 nm, which is the range visible to the human eye.
Video
143
Samsung Galaxy S25 Ultra
Samsung Galaxy S25 Ultra
How Display Video score is composed
The video attribute evaluates the Standard Dynamic Range (SDR) and High Dynamic Range (HDR10) video handling in indoor and low-light conditions . Our measurements run in the labs are completed by perceptual testing and analysis.
Video peak luminance vs Lighting conditions
This bar chart presents the peak luminance measured for SDR and HDR10 content on a 10% window white pattern.
Video peak luminance vs Lighting conditions
This bar chart presents the peak luminance measured for SDR and HDR10 content on a 10% window white pattern.
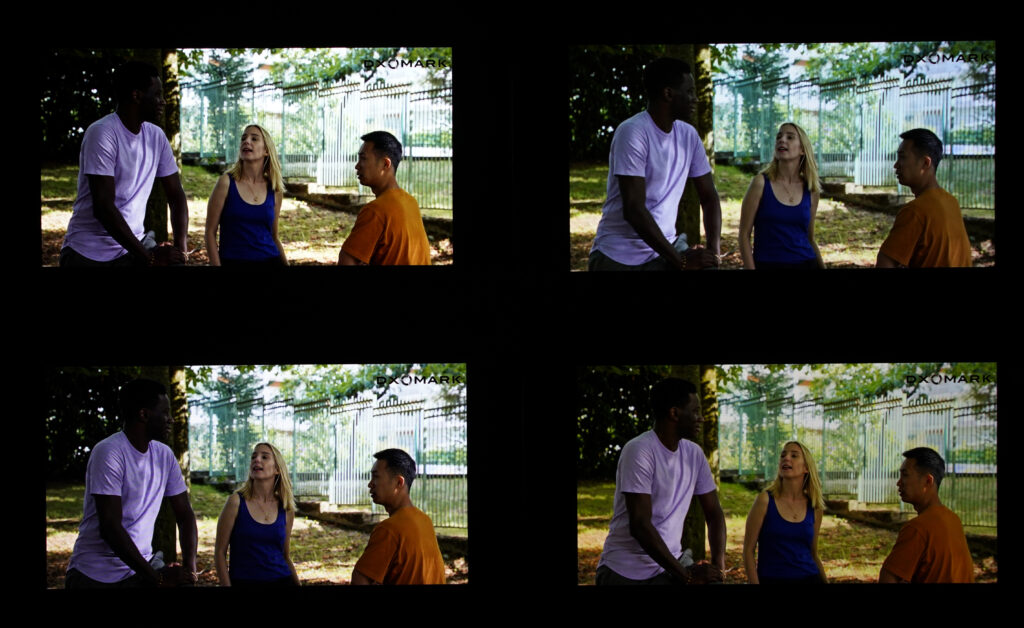
Video rendering in a low-light (0 lux) environment
Clockwise from top left: Asus Zenfone 11 Ultra, Honor Magic6 Pro, Apple iPhone 15 Pro Max, Huawei Mate 60 Pro
(Photos for illustration only)
SDR video EOTF curve
These curves represent the SDR video tone distribution for white color.
The Electro-Optical Transfer Function (EOTF) defines how bits are converted into luminance out of the display. Gray levels (horizontal axis) represent the different shades from pure white (100% gray level) to pitch black (0% gray level). The standard for SDR videos follows a 2.2 gamma. The flatter the curves, the harder it is to perceive differences between consecutive shades. This phenomenon is more frequent under bright lighting conditions (830 lux) in the low gray levels region (< 30%).
HDR10 video EOTF curve
These curves represent the HDR10 video tone distribution for white color.
The Electro-Optical Transfer Function (EOTF) defines how bits are converted into luminance out of the display. Gray levels (horizontal axis) represent the different shades from pure white (100% gray level) to pitch black (0% gray level). While the PQ (Perceptual Quantizer) standard is reminded here for reference, it cannot be a target for smartphones as it is an absolute standard whereas smartphones adapt their brightness to lighting conditions. The flatter the curves, the harder it is to perceive differences between consecutive shades. This phenomenon is more frequent under bright lighting conditions (830 lux) in the low gray levels region (< 30%).
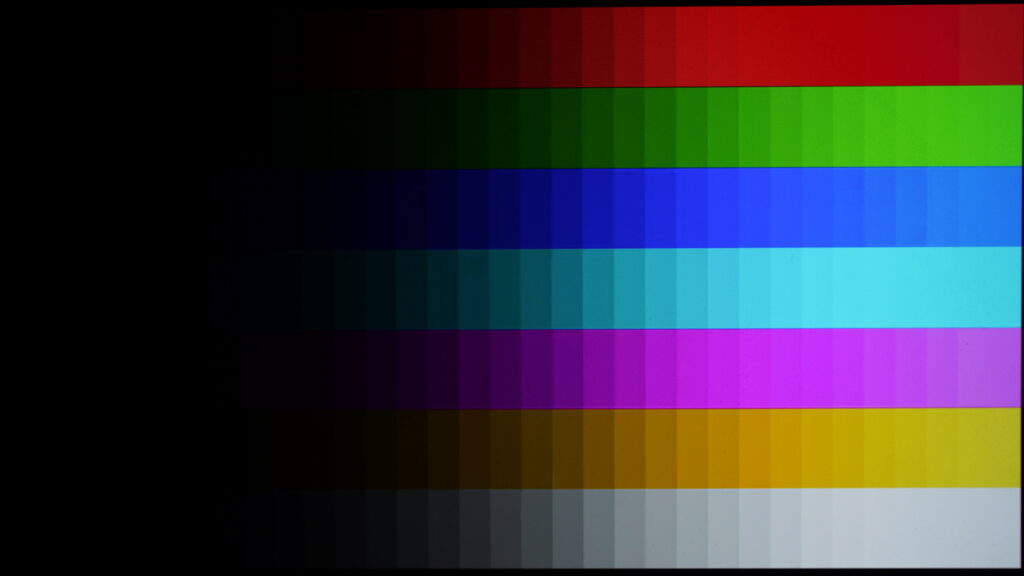
Gamut coverage for video content under 0 lux environment
The primary colors are measured both in HDR10 and SDR. The solid color gamut measures the extent of the color area that the device can render in total darkness. The dotted line represents the content’s artistic intent. The measured gamut should match the master color space of each video.
Gamut coverage for video content under 830 lux environment
The primary colors are measured both in HDR10 and SDR. The solid color gamut measures the extent of the color area that the device can render in total darkness. The dotted line represents the content’s artistic intent. The measured gamut should match the master color space of each video.
We measured a reduced gamut with HDR10 content (top right graph). As shown in the illustration below, we observed strong changes in color rendering when displaying higher-intensity colors. But this effect was limited in typical video scenes that contained colors of lesser intensity.
In HDR10, the colors become desaturated, particularly blue, as the colors brighten.
SDR Video Frame Drops FHD at 30 fps
Asus Zenfone 11 Ultra
Honor Magic6 Pro
Apple iPhone 15 Pro Max
Huawei Mate 60 Pro
HDR Video Frame Drops UHD at 30 fps
Asus Zenfone 11 Ultra
Honor Magic6 Pro
Apple iPhone 15 Pro Max
Huawei Mate 60 Pro
These gauges present the percentage of frame irregularities in a 30-second video. These irregularities are not necessarily perceived by users (unless they are all located at the same time stamp) but are an indicator of performance.
Touch
135
Google Pixel 7 Pro
Google Pixel 7 Pro
How Display Touch score is composed
We evaluate the touch attributes under many types of contents where touch is key, and requires different behaviors such as gaming (quick touch to response time), web (smooth scrolling of the page) and images (accurate and smooth navigation from one image to another).
Average Touch Response Time Asus Zenfone 11 Ultra
103 ms
Fast
Good
Bad
Slow
Asus Zenfone 11 Ultra
Honor Magic6 Pro
Apple iPhone 15 Pro Max
Huawei Mate 60 Pro
Touch To Display response time
This response time test precisely evaluates the time elapsed between a single touch of the robot on the screen and the displayed action. This test is applied to activities that require high reactivity, such as gaming.