We put the Acer Swift GO 14 through our rigorous DXOMARK Laptop test suite to measure its performance in sound, camera and display. In this review, we will break down how it fared in a variety of tests and several common use cases.
Overview
Scoring
Use-case and feature subscores included in the calculations of the global score
 Acer Swift Go 14

90
camera
62
Apple MacBook Pro 14" (M3 Pro, 2023)
Best: Apple MacBook Pro 14" (M3 Pro, 2023) (93)
32
Lenovo ThinkPad X9 Aura
Best: Lenovo ThinkPad X9 Aura (56)
49
Apple MacBook Pro 14" (M3 Pro, 2023)
Best: Apple MacBook Pro 14" (M3 Pro, 2023) (76)
78
Apple MacBook Pro 14" (M2 Pro, 2023)
Best: Apple MacBook Pro 14" (M2 Pro, 2023) (83)
113
display
56
Apple MacBook Pro 14" (M3 Pro, 2023)
Best: Apple MacBook Pro 14" (M3 Pro, 2023) (84)
61
Apple MacBook Pro 14" (M3 Pro, 2023)
Best: Apple MacBook Pro 14" (M3 Pro, 2023) (95)
67
Honor MagicBook View 14 (2022)
Best: Honor MagicBook View 14 (2022) (84)
105
audio
98
Apple MacBook Pro 14" (M2 Pro, 2023)
Best: Apple MacBook Pro 14" (M2 Pro, 2023) (149)
137
Asus Zenbook 14X OLED (2023)
Best: Asus Zenbook 14X OLED (2023) (153)
Pros
- Quite extended focus range, which is useful in a big room
- Good SDR experience
- Good microphone audio dynamics and spatial performance during video call capture
- Good audio dynamics and spatial performance during multimedia playback
Cons
- Occasional visible camera exposure instabilities and low target exposure in backlit scenes
- Peak brightness of 500 nits too low for comfortable viewing in bright environments
- Highly reflective screen
- Impaired intelligibility due to poor timbre performance in audio capture and playback
The Acer Swift GO 14 features a decent overall camera performance; compared to current competitors, however, its display and audio performance needs improvement. The camera features a fairly extended focus range, which can help to keep the scene in focus when people are positioned at different distances from the camera, and manages noise well in indoor conditions, but it struggles at times with exposure. The display offers a good SDR experience and good uniformity across its entire surface, but the screen is highly reflective, which users can find disturbing; moreover, ghosting can be slightly visible. While the device does a good job with dynamics and spatial rendering during video call capture, it has poor timbre, dynamics, and spatial rendering during playback.
Test summary
About DXOMARK Laptop tests: For scoring and analysis in our laptop reviews, DXOMARK engineers perform a variety of objective tests and undertake more than 20 hours of perceptual evaluations under controlled lab conditions and real-life scenarios.(For more details about the Laptop protocol, click here.)
The following section gathers key elements of our exhaustive tests and analyses performed in DXOMARK laboratories. Detailed performance evaluations under the form of reports are available upon request. Do not hesitate to contact us.
Acer Swift GO 14 overall & use-cases scores
Camera
90
Apple MacBook Pro 14" (M4, 2024)
Apple MacBook Pro 14" (M4, 2024)
About DXOMARK Camera Laptop tests
DXOMARK evaluates the image quality of the built in camera during video calls, whether with a single person or with multiple people, in a variety of lighting conditions. Our camera evaluation particularly assesses the ability of the built-in camera to clearly render human faces during video calls. Other intrinsic camera quality aspects are also evaluated, like color reproduction, texture and noise, as well as artefacts.
The Acer camera’s wide focus range makes it quite useful in a bigger room, although exposure instabilities are sometimes visible and target exposure is sometimes a bit low in backlit scenes. The device’s microphone provides good audio dynamics and spatial performance during video calls, although intelligibility can be impaired due to poor timbre performance in both audio capture and playback.
The following chart presents the camera subscores for the video call use case:
Camera texture acutance on Deadleaves with illuminance levels
This graph shows the evolution of texture acutance with the level of lux measured on a Deadleaves chart.
The following graphs show the objective measurements performed in our camera labs:
Camera visual noise evolution with illuminance levels
This graph shows the evolution of spatial visual noise with the level of lux. Spatial visual noise is measured on the visual noise chart in the video noise setup. DXOMARK visual noise measurement is derived from ISO15739 standard.
Target exposure on face with illuminance levels
These measurements take place on a setup combining realistic mannequins and a backlit panel simulating high dynamic range conditions. This graph shows the evolution of lightness measured on the forehead of the realistic mannequin with the level of lux, for multiple lighting conditions. The lightness is measured in L*. Delta EV specifies the difference of luminance in stops between the face and the light panel simulating HDR conditions.
Target exposure on face with illuminance levels in HDR conditions
These measurements take place on a setup combining realistic mannequins and a backlit panel simulating high dynamic range conditions. This graph shows the evolution of lightness measured on the forehead of the realistic mannequin with the level of lux, for multiple lighting conditions. The lightness is measured in L*. Delta EV specifies the difference of luminance in stops between the face and the light panel simulating HDR conditions.
Audio
105
Huawei MateBook X Pro 2024
Huawei MateBook X Pro 2024
About DXOMARK Audio Laptop tests
Combining objective and perceptual testing in our labs and in real life conditions, DXOMARK evaluates the audio performance on two main use cases: video call and music & video. On video call, our engineers look at the quality of the audio playback and capture, and particularly the intelligibility of speaker’s voices. One specific aspect that is also evaluated is the duplex performance, in situations where more than one person is talking, making sure that there’s no echo or gating and that necessary sounds are not lost.
The laptop has good audio dynamics and spatial performance during multimedia playback.
The following chart presents the capture subscores for the video call use case:
Audio capture scores comparison
The following graphs show the frequency response, distortion and directivity in capture, recorded in our semi-anechoic room:
Audio capture frequency response
A 1/12 octave frequency response graph, which measures the volume of each frequency captured by the laptop when recording an objective test signal at 1 meter in an anechoic environment.
Audio capture directivity
Directivity graph of the laptop microphone(s) when capturing test signals using the camera app. It represents the acoustic energy (in dB) over the angle of incidence of the sound source (normalized to the angle 0°, in front of the device).
The following chart presents the playback for the multimedia use case:
Audio playback scores comparison
The following graphs show the frequency response, distortion and directivity in multimedia playback, recorded in our semi-anechoic room:
Audio playback frequency response
A 1/12 octave frequency response graph, which measures the volume of each frequency emitted by the laptop when playing a pure-sine wave in an anechoic environment.
Audio playback Total Harmonic Distortion + Noise
Display
113
Apple MacBook Pro 14" (M3 Pro, 2023)
Apple MacBook Pro 14" (M3 Pro, 2023)
About DXOMARK DisplayLaptop tests
Through objective testing, DXOMARK evaluates the display performance by looking at 3 main aspects: Readability, HDR & SDR performances. While evaluating readability, our engineers will particularly focus on screen brightness, contrast, and reflectance, assessing the ease and comfort of viewing displayed images indoors. We also evaluate HDR & SDR performance while looking at video contents, verifying that the display rendering respects the original artistic intent of the filmmaker
The Swift GO 14 provides a good SDR experience. But it has a highly reflective screen, and its peak brightness of less than 500 nits is too low for comfortable viewing in an intense lighting environment.
The following chart presents the display subscores:
Display scores comparison
The following graphs show the objective measurements performed in our display lab:
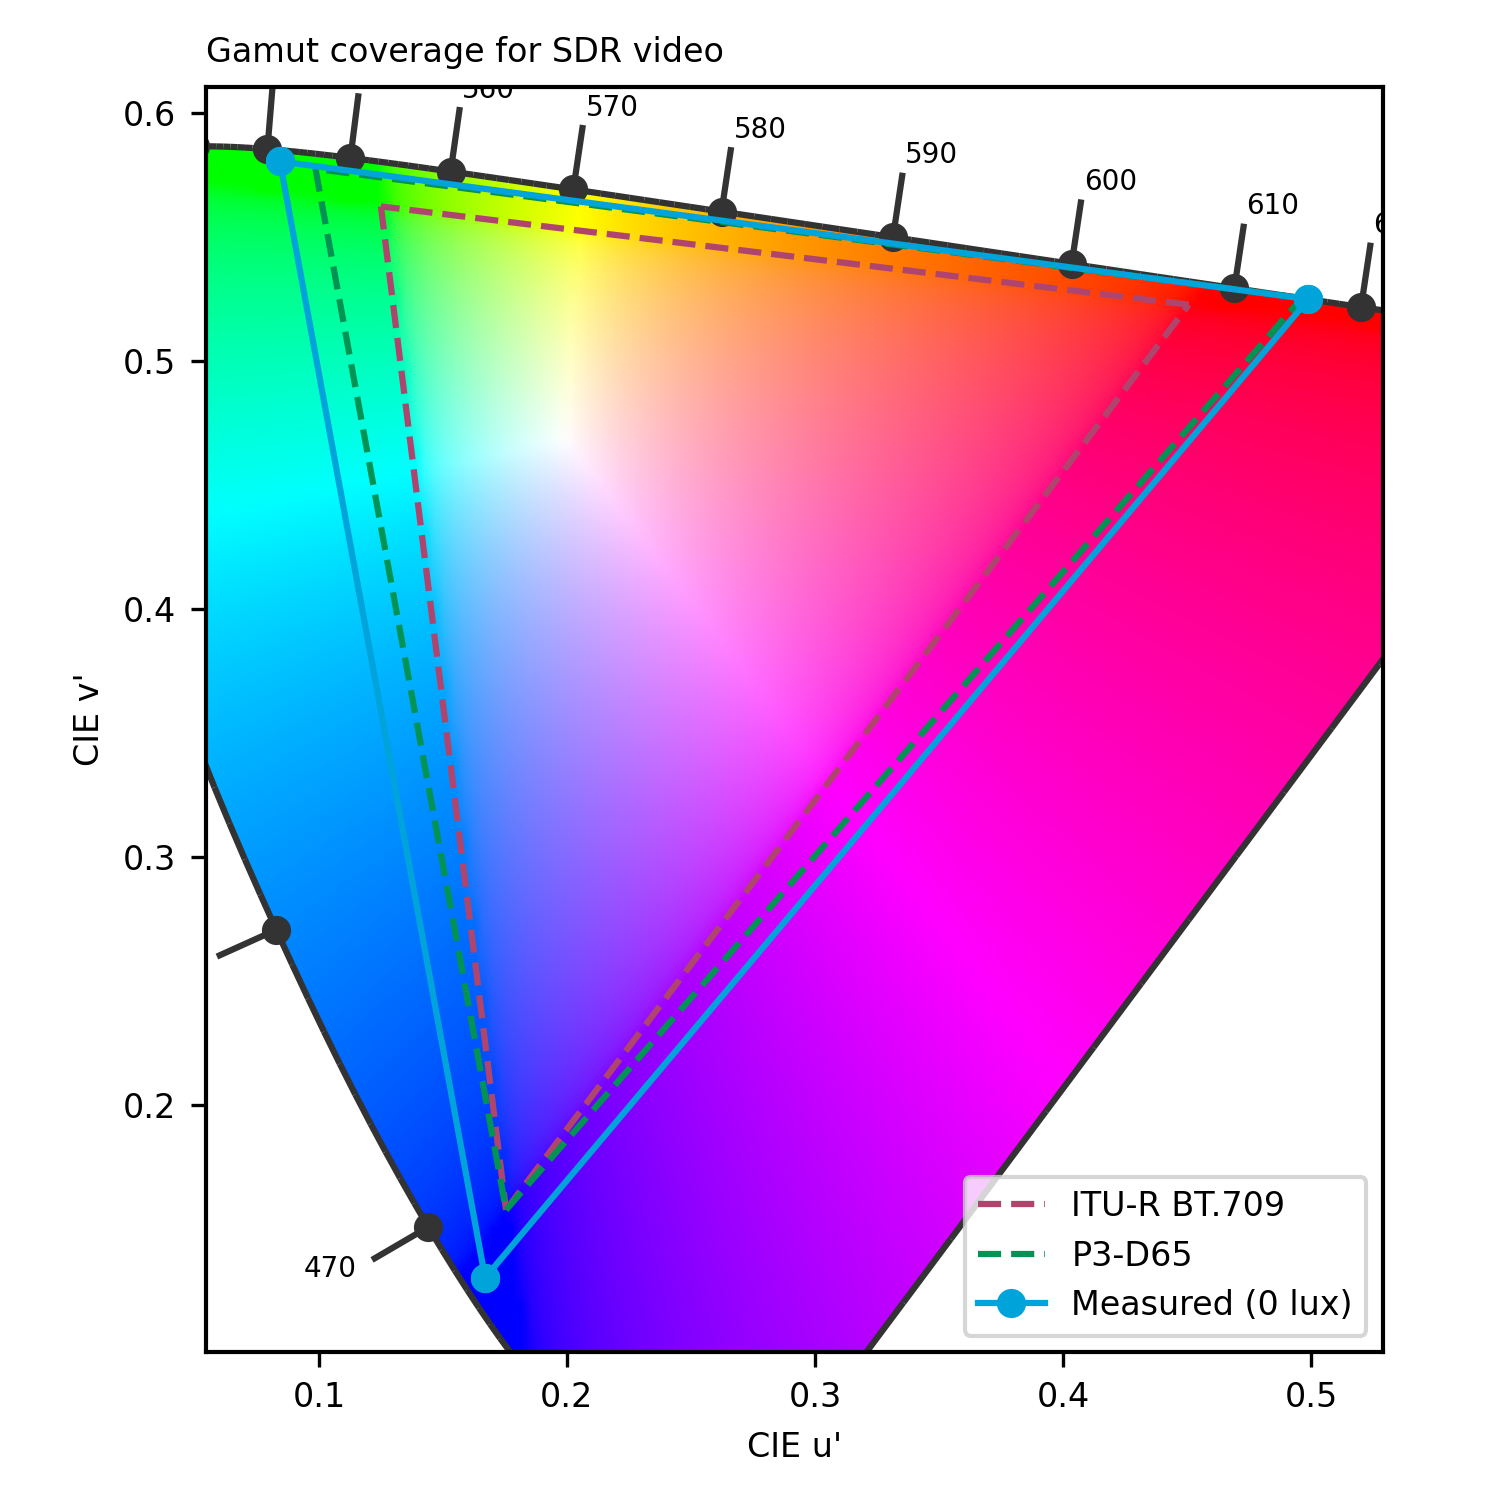
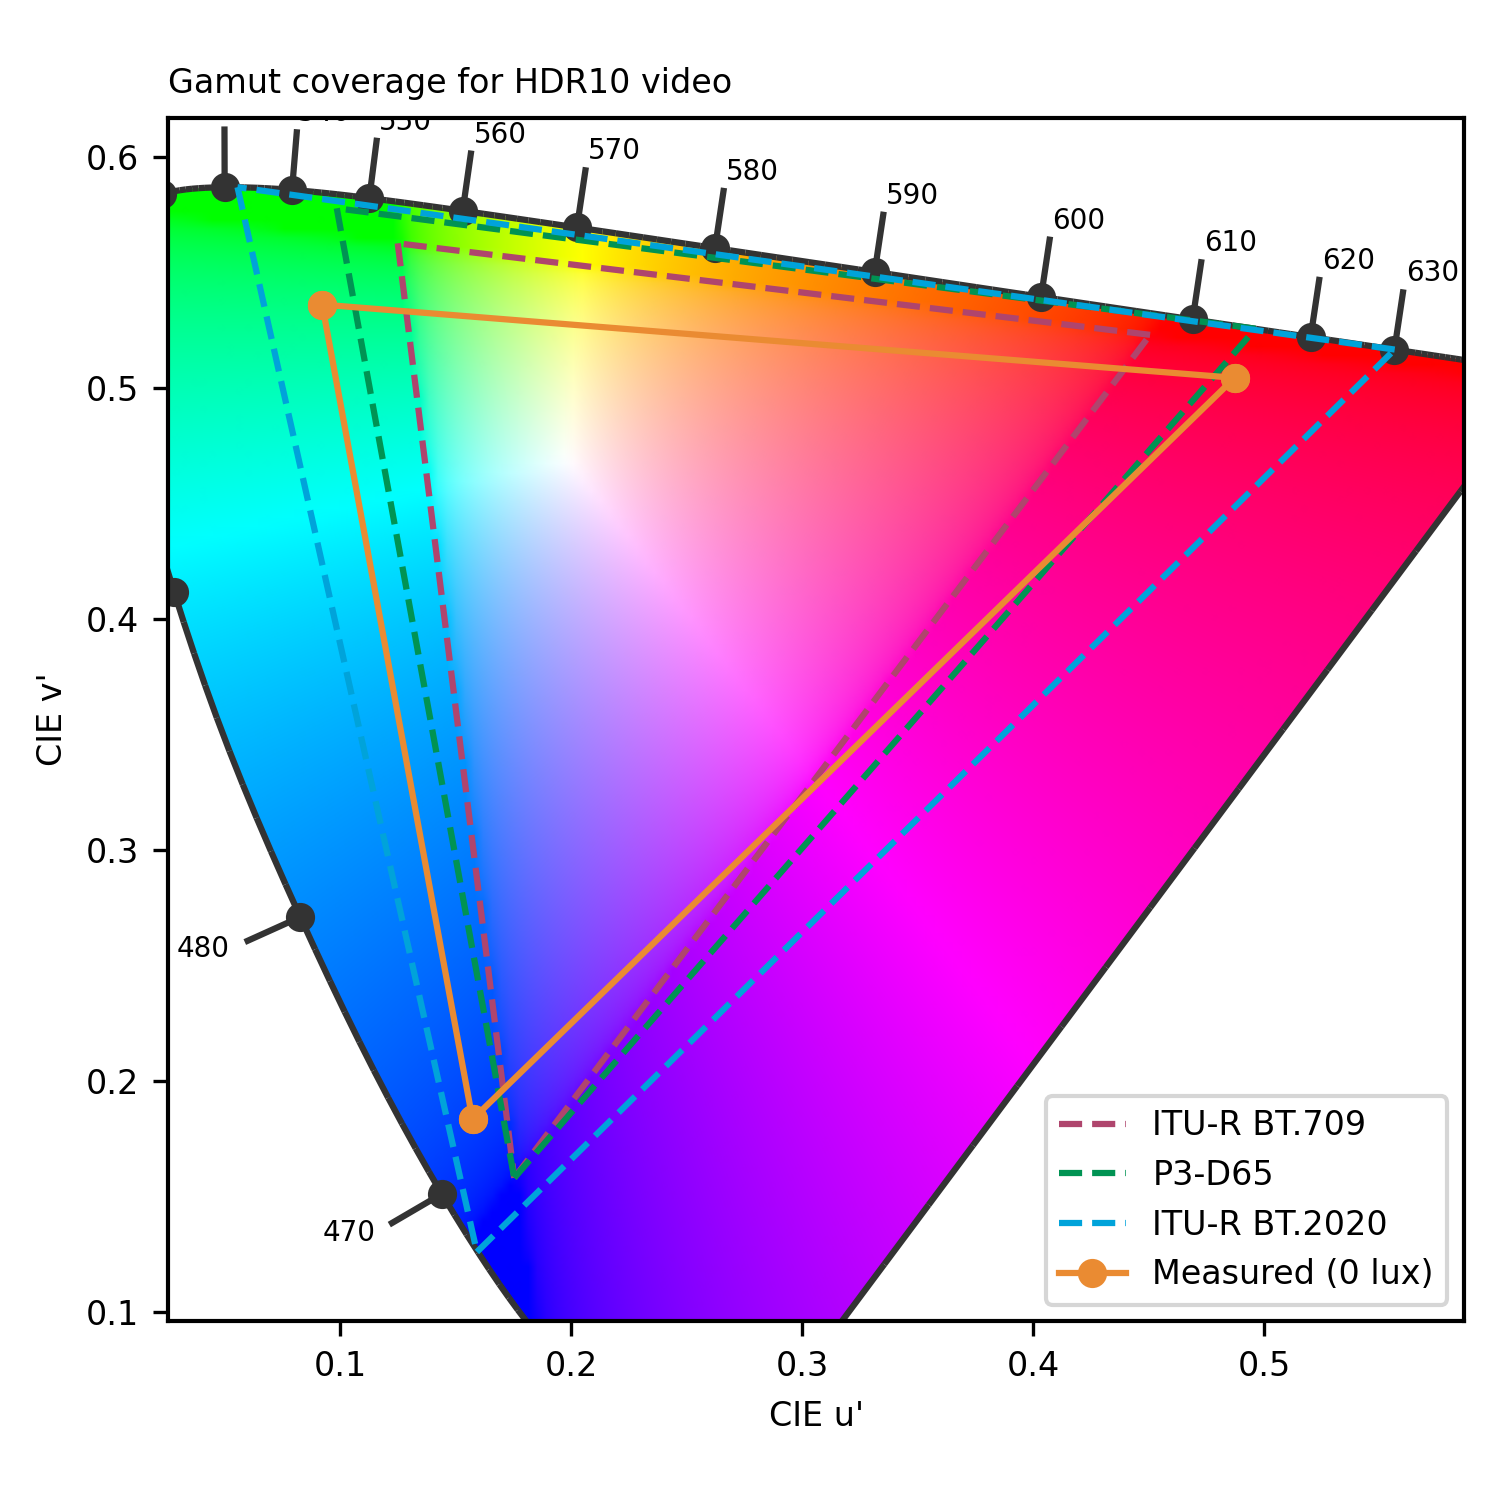
Display gamut coverage for video contents
The primary colors are measured both in HDR10 and SDR. The extracted color gamut shows the extent of the color area that the device can render. To respect the artistic intent, the measured gamut should match the master color space of each video.
Display reflectance measurement (SCI)
Measurements above show the reflection of the device within the visible spectrum range (400 nm to 700 nm). It includes both diffuse and specular reflection.
Display reflectance profile
Display brightness uniformity
0.636
cd/m²
0.605
cd/m²
0.602
cd/m²
0.682
cd/m²
0.659
cd/m²
0.656
cd/m²
0.69
cd/m²
0.701
cd/m²
0.695
cd/m²
 Distribution of brightness (min)
436.3
cd/m²
432.7
cd/m²
435.2
cd/m²
430.3
cd/m²
427.9
cd/m²
431.1
cd/m²
427.7
cd/m²
423
cd/m²
431.6
cd/m²
Distribution of brightness (max)
This illustration shows the brightness measured on nine zones of the display for minimum brightness (left) and maximum brightness (right) for SDR content.
Display SDR EOTF measurement
This graph represents the rendering of contrast (gray levels) for SDR video content, measured in the dark. We expect to be close to the 2.2 or 2.4 gamma references.
Display peak brightness for video contents
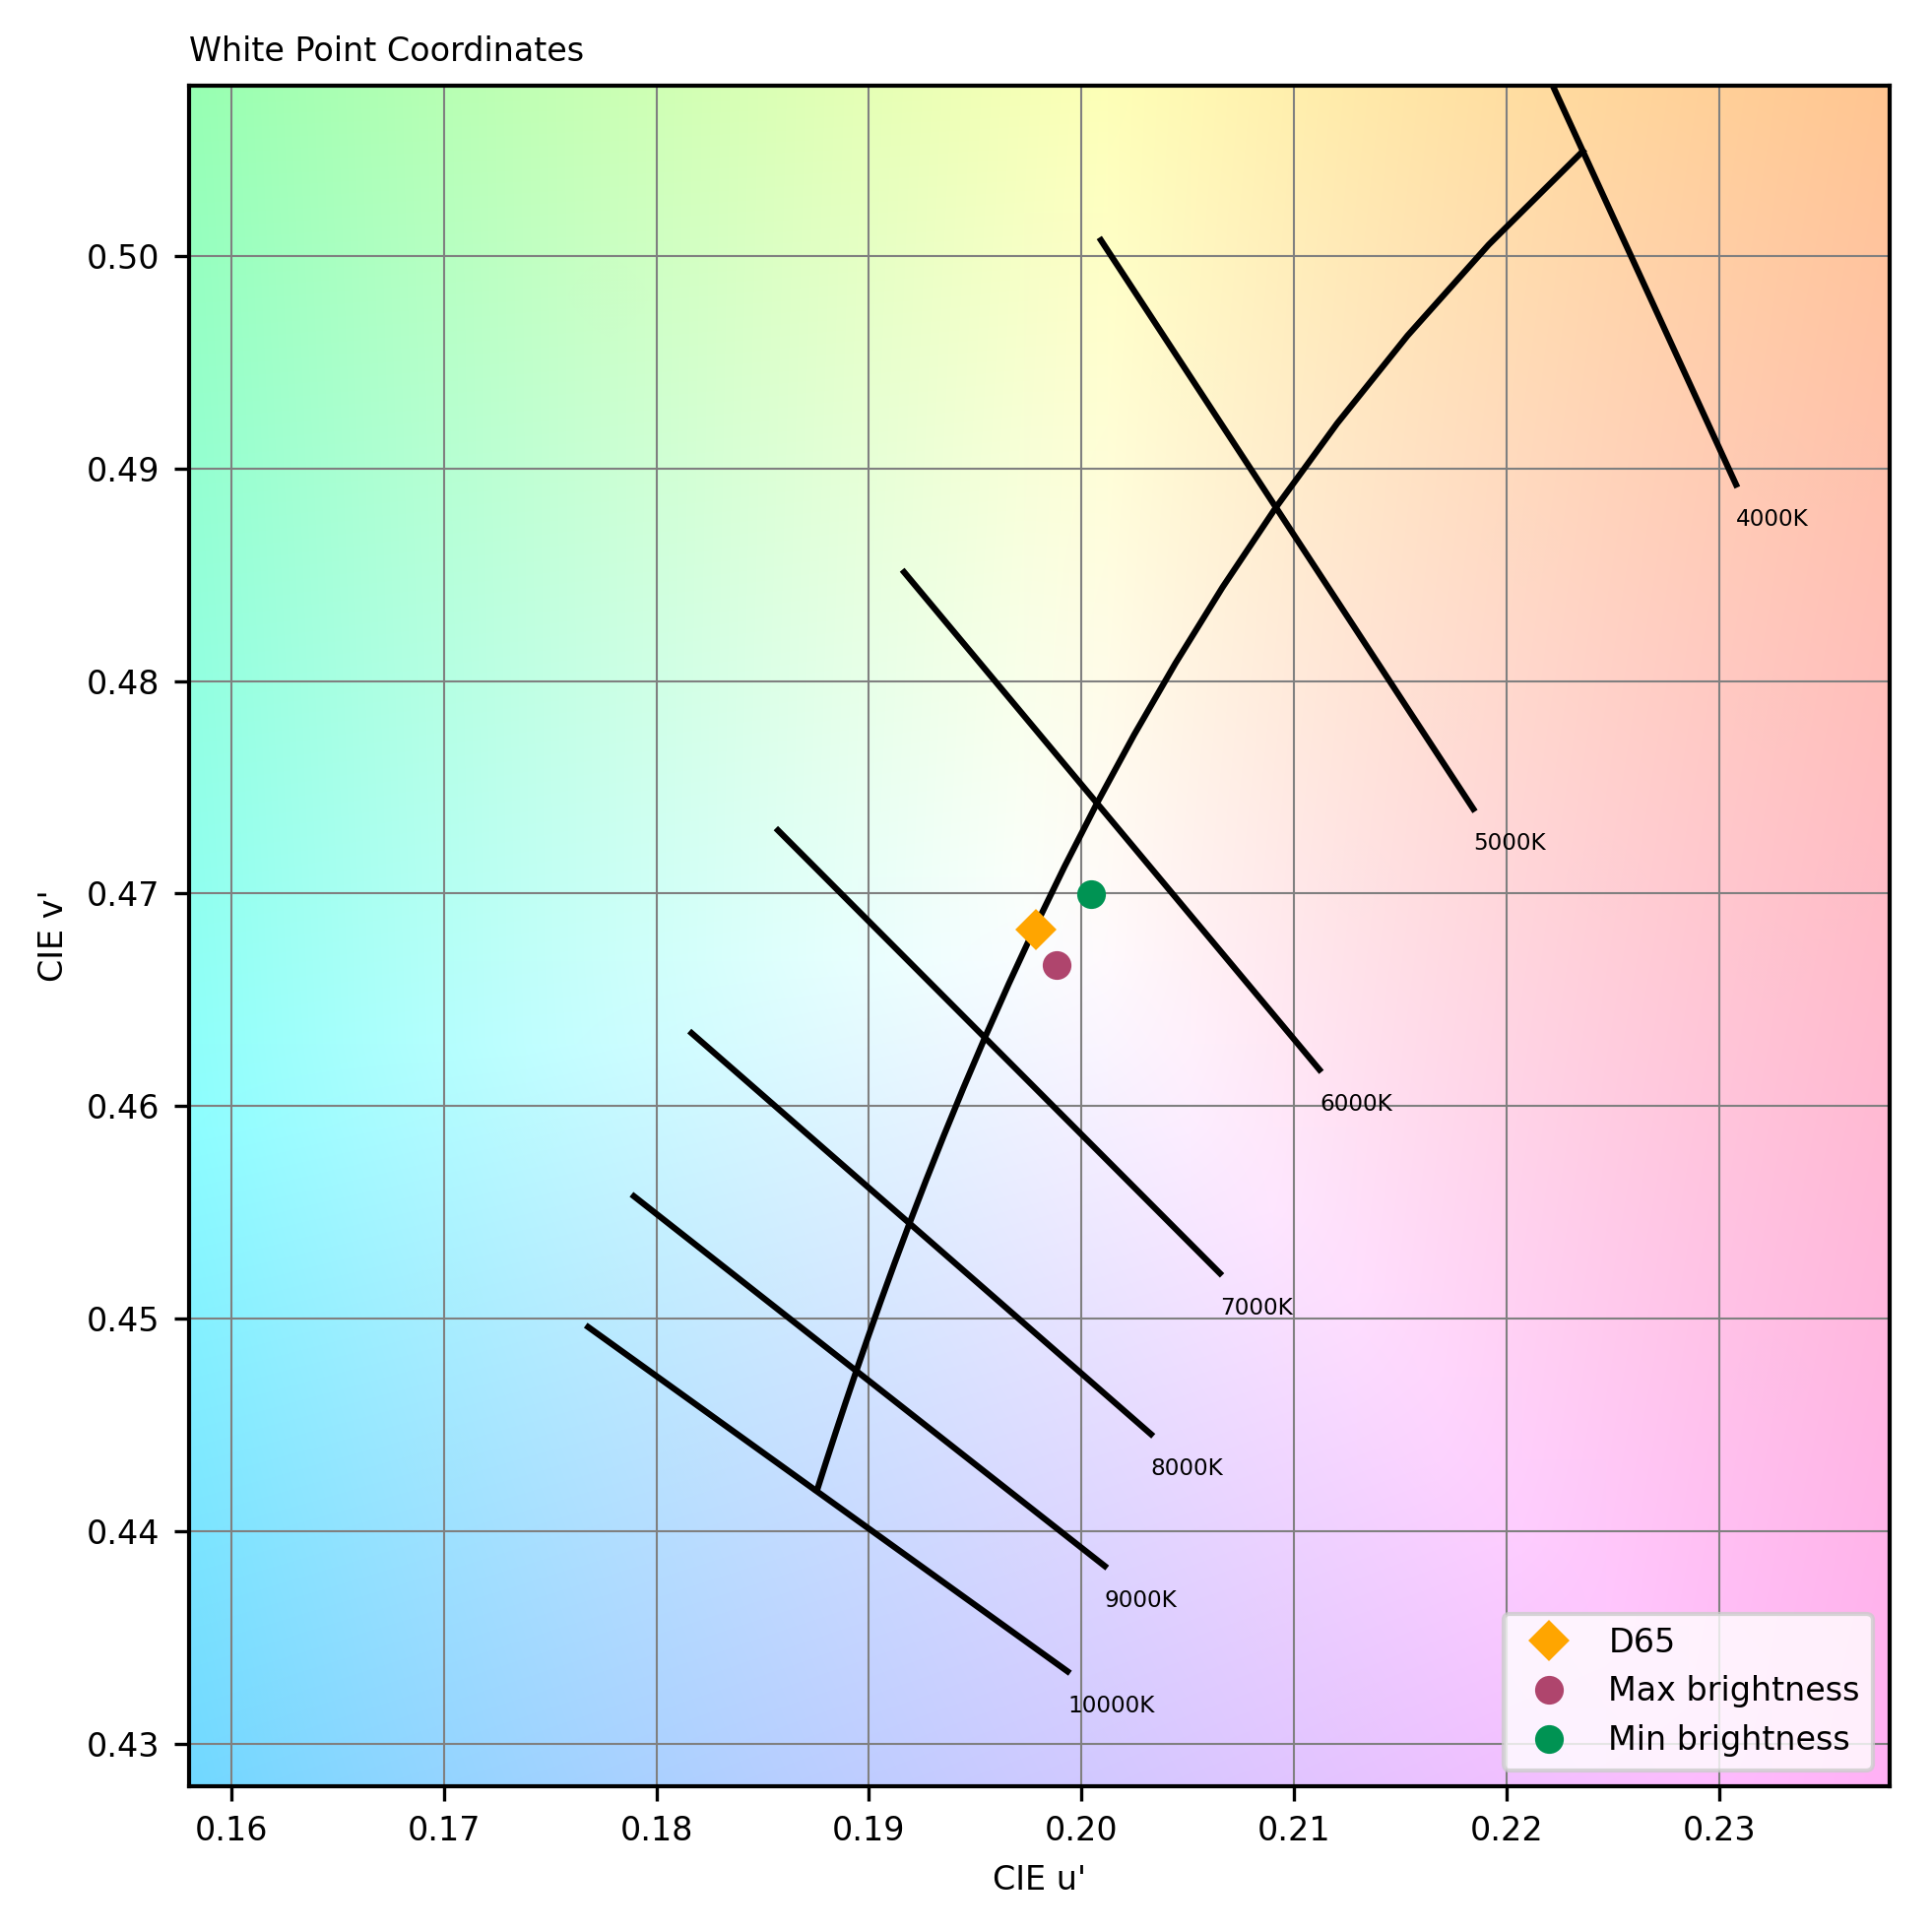
Display white point
This graph represents the color temperature of white content, compared with the reference (Daylight illuminant D65) measured in the dark on video at minimum and maximum brightness.