We put the Xiaomi 14T Pro through our rigorous DXOMARK Camera test suite to measure its performance in photo, video, and zoom quality from an end-user perspective. This article breaks down how the device fared in a variety of tests and several common use cases and is intended to highlight the most important results of our testing with an extract of the captured data.
Overview
Key camera specifications:
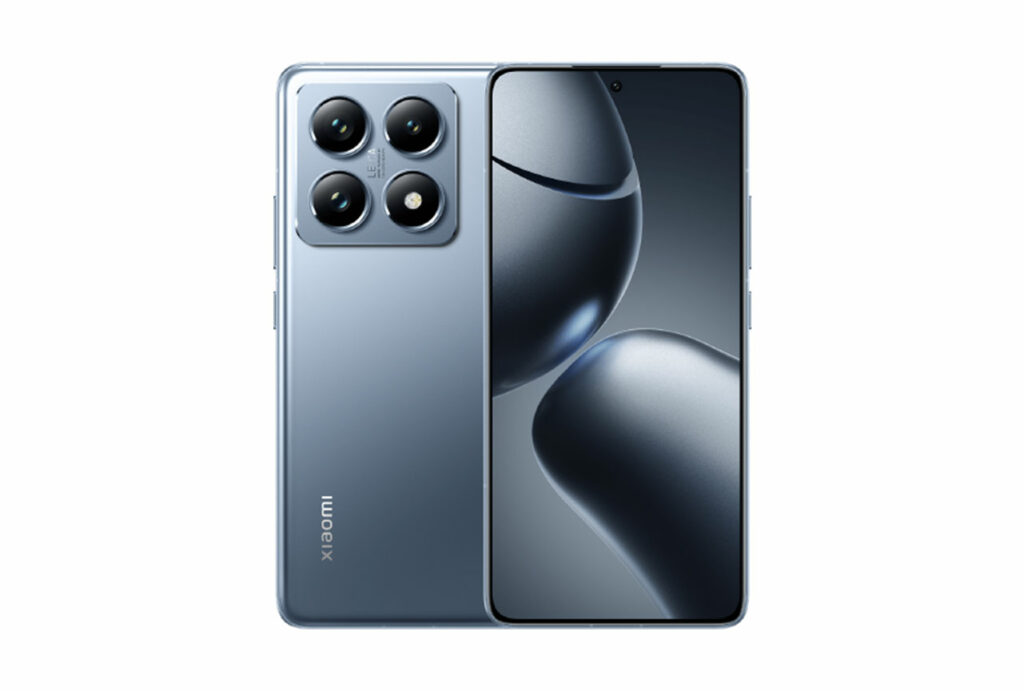
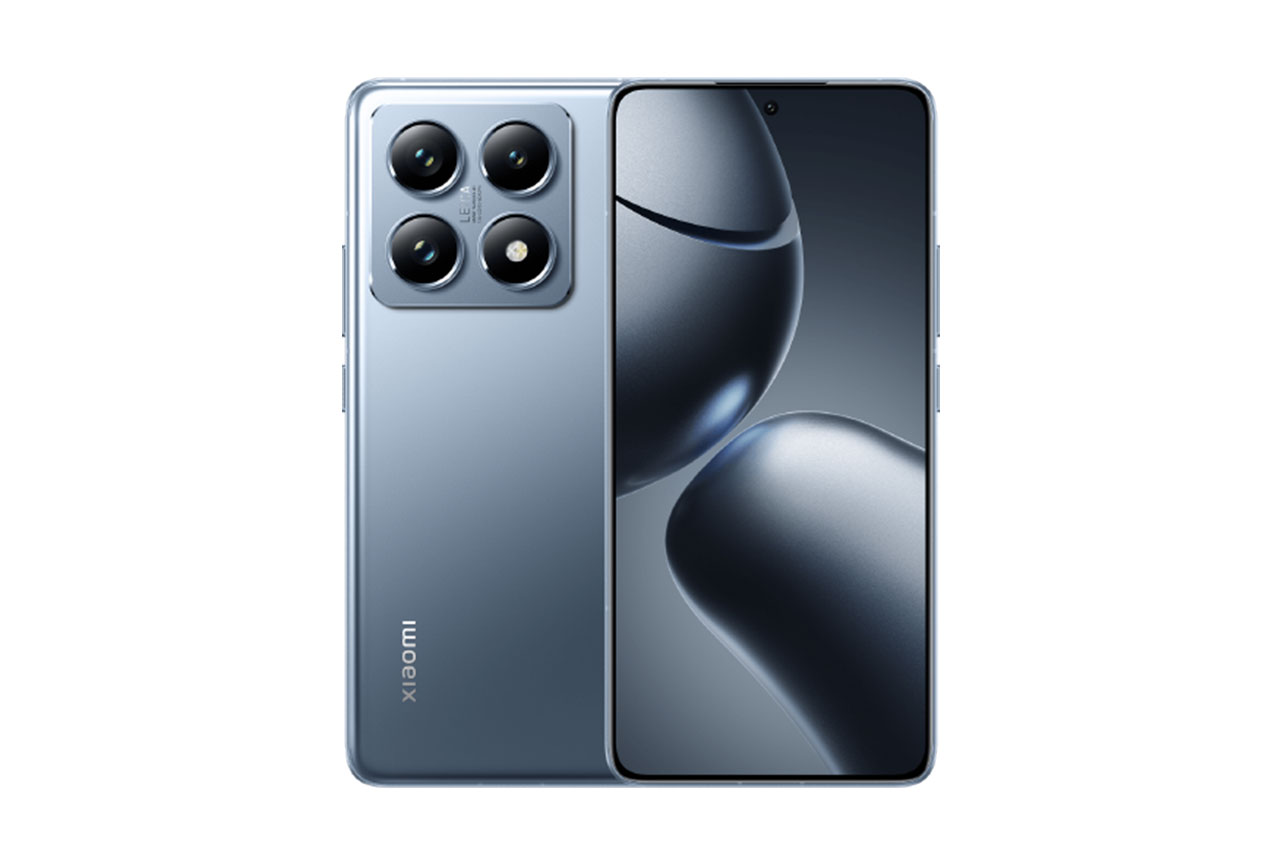
- Primary: 50MP, 1/1.31″ sensor, super Pixel 4-in-1, 2.4 µm pixels, 23mm equivalent f/1.6-aperture lens, OIS
- Ultra-wide: 12MP, f/2.2, 15mm equivalent, 120° field of view
- Tele: 50MP, f/2.0, 60mm equivalent
Scoring
Sub-scores and attributes included in the calculations of the global score.
Xiaomi 14T Pro
Use cases & Conditions
Use case scores indicate the product performance in specific situations. They are not included in the overall score calculations.
Outdoor
Photos & videos shot in bright light conditions (≥1000 lux)
Indoor
Photos & videos shot in good lighting conditions (≥100lux)
Lowlight
Photos & videos shot in low lighting conditions (<100 lux)
Friends & Family
Portrait and group photo & videos
Pros
- Mostly good exposure when contrasts are not too strong
- Wide depth of field
- Nice skin tone rendering in bright light photos
- Good exposure and wide dynamic range in video mode
- Stable and smooth video autofocus
- Effective video stabilization
Cons
- Limited dynamic range, especially noticeable in high-contrast scenes
- Some loss of fine detail when shooting indoors or in low light, for both photo and video
- Exposure and white balance instabilities across consecutive shots and in video
- Noise in indoor and low-light photos and videos
- Desaturated colors, especially in bright daylight
- Exposure and color instabilities in bokeh mode
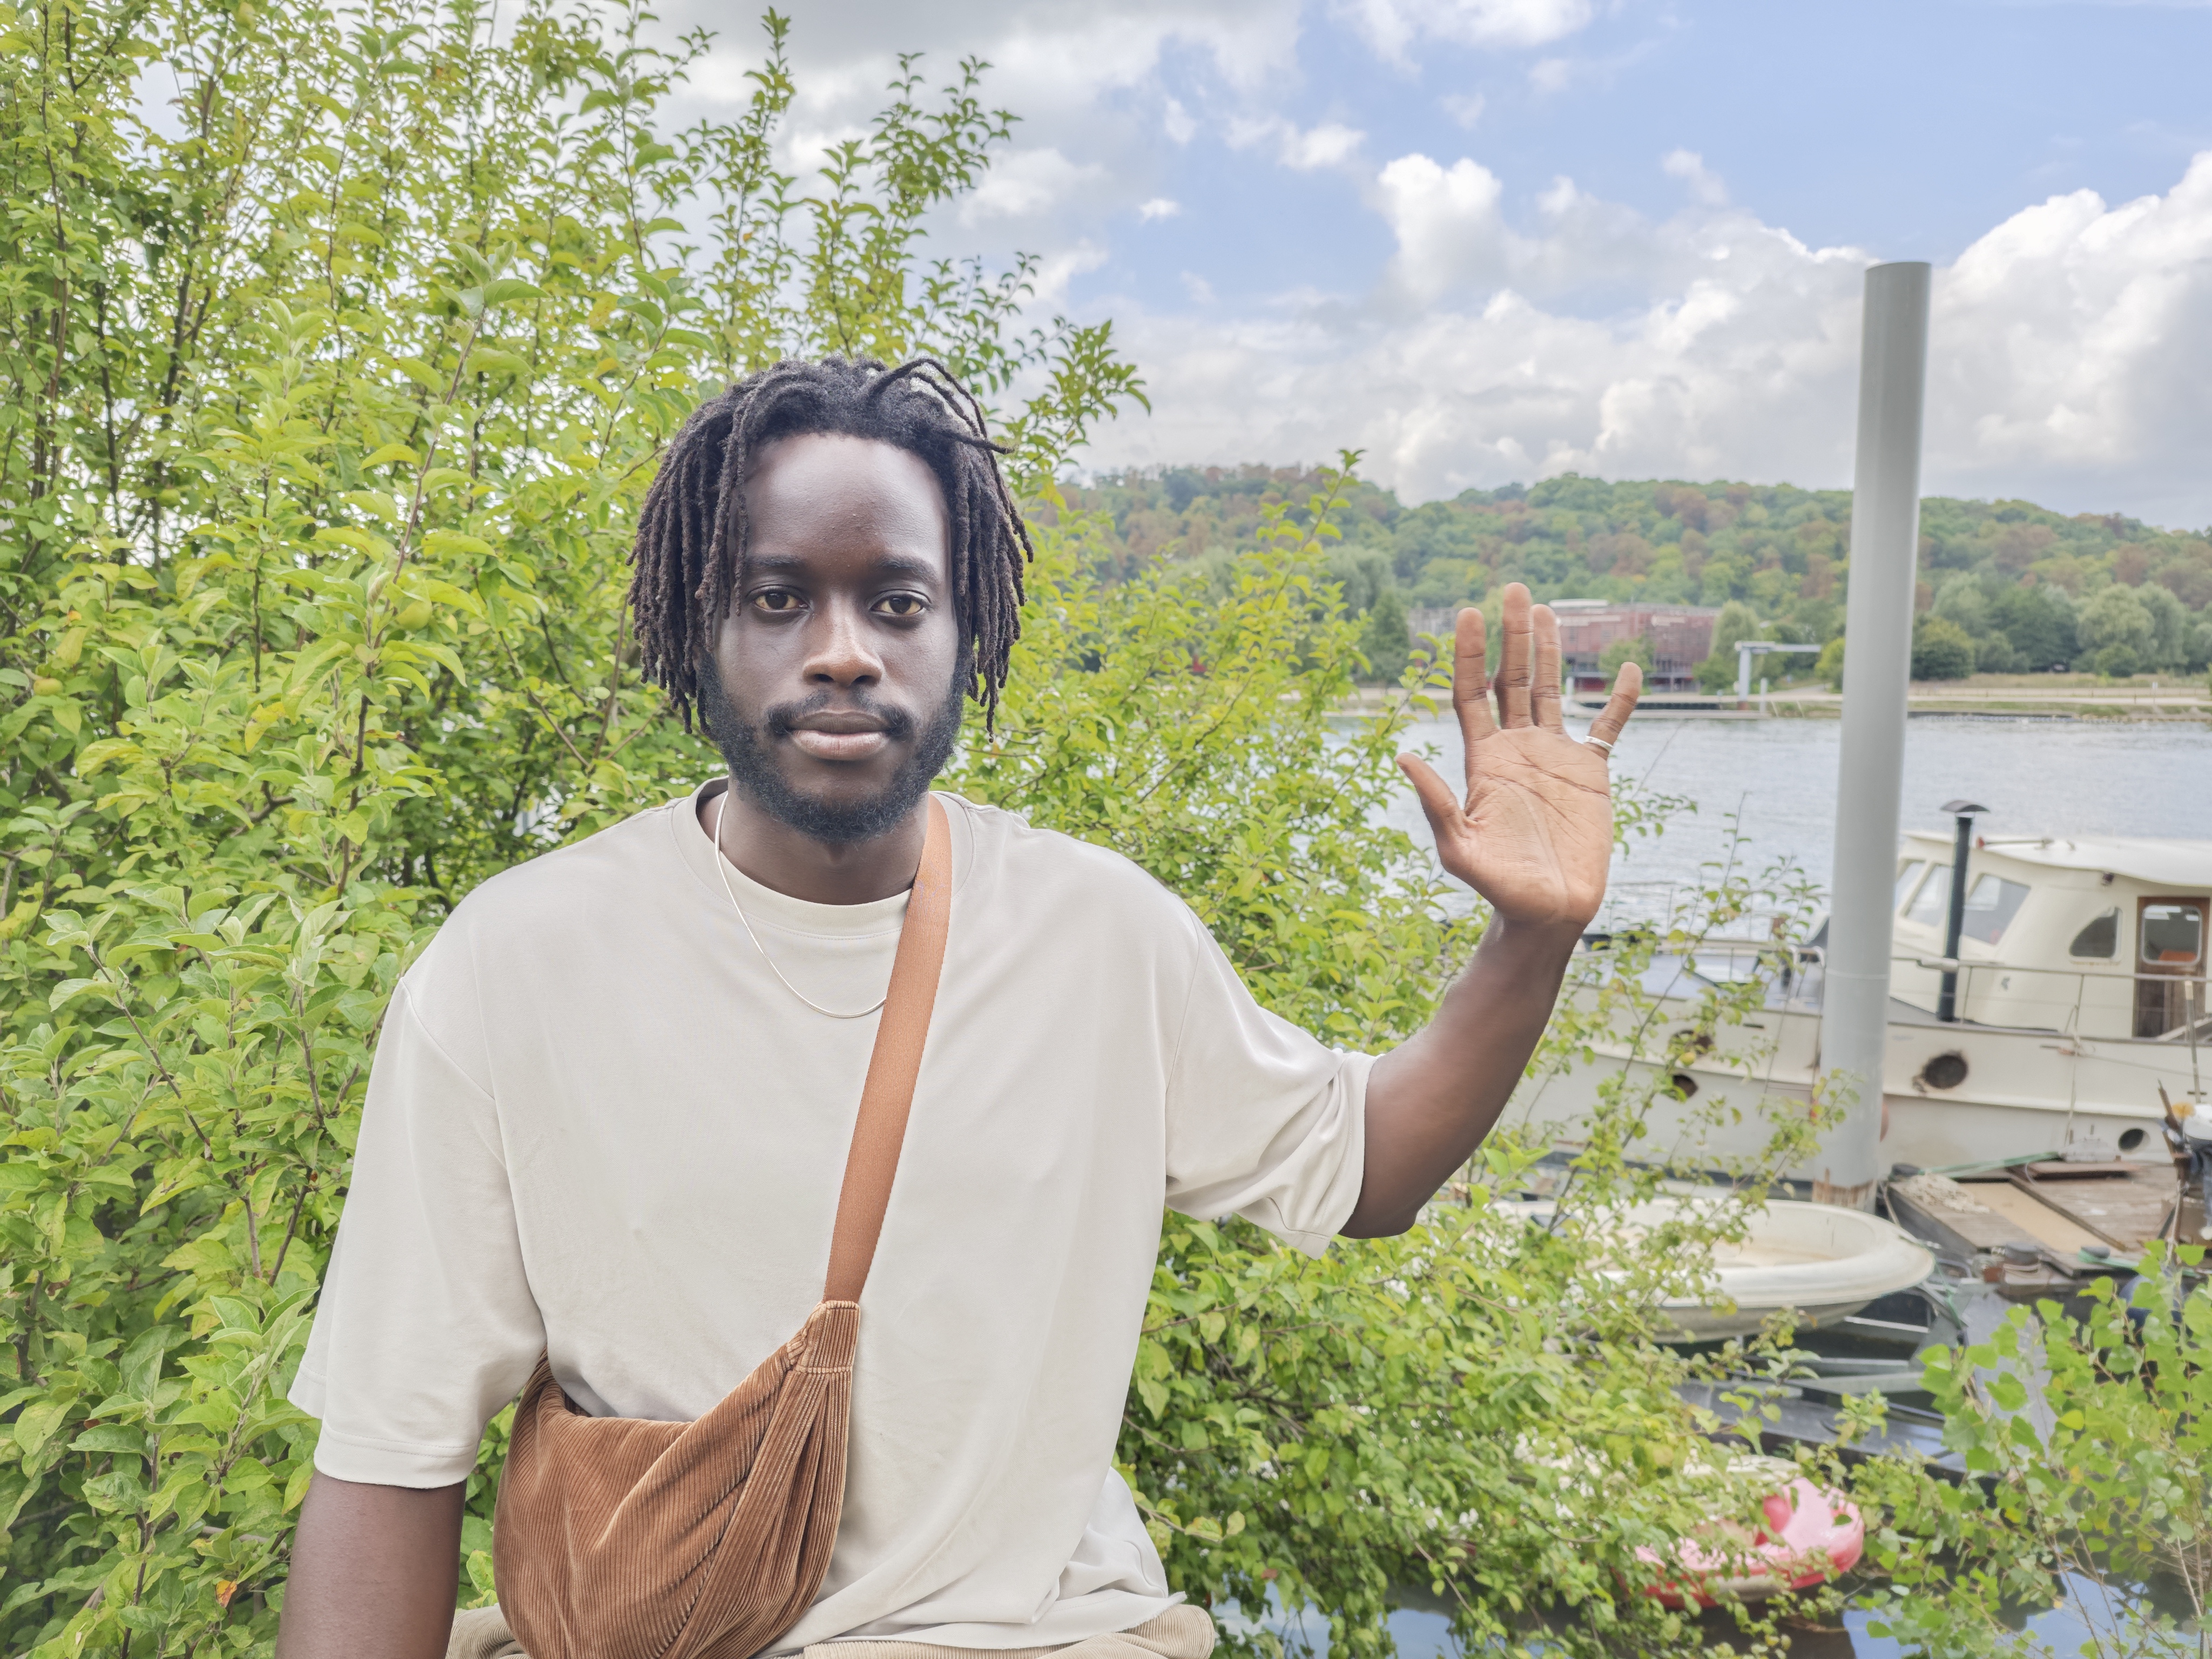
The Xiaomi 14T Pro delivered a good performance in the DXOMARK Camera tests, securing a spot among the best in the device ranking for the Premium segment. Overall, still image and video quality was pretty decent and quite similar to the Xiaomi 14. In our tests, the camera did well when shooting landscape images and outdoor portraits, but a lack of detail was noticeable in low-light images.
Ultra-wide images came with good exposure and nice colors when shooting in bright light or indoors. However, our testers observed a lack of detail and some unwanted image artifacts, including color fringing, anamorphosis and edge softness. Tele-zoom quality was decent at close and medium range but images lacked detail. At longer tele settings, with the dedicated tele module fully taking over, images offered a wide dynamic range, accurate exposure and nice colors.
In video mode, exposure was good and our sample clips showed good highlight and shadow detail. In addition, both autofocus and stabilization systems worked well. However, colors could look desaturated and we observed a lack of fine detail. Exposure adaptation issues could occur as well.
Please note that for this review, the device’s videos were captured and analyzed in HDR mode. You will need a compatible HDR screen to visualize the videos’ HDR exposure and color renderings on the YouTube player.
Test summary
About DXOMARK Camera tests: DXOMARK’s Camera evaluations take place in laboratories and in real-world situations using a wide variety of subjects. The scores rely on objective tests for which the results are calculated directly by measurement software on our laboratory setups, and on perceptual tests in which a sophisticated set of metrics allow a panel of image experts to compare aspects of image quality that require human judgment. Testing a smartphone involves a team of engineers and technicians for about a week. Photo, Zoom, and Video quality are scored separately and then combined into an Overall score for comparison among the cameras in different devices. For more information about the DXOMARK Camera protocol, click here. More details on smartphone camera scores are available here. The following section gathers key elements of DXOMARK’s exhaustive tests and analyses. Full performance evaluations are available upon request. Please contact us on how to receive a full report.
Photo
Xiaomi 14T Pro
169
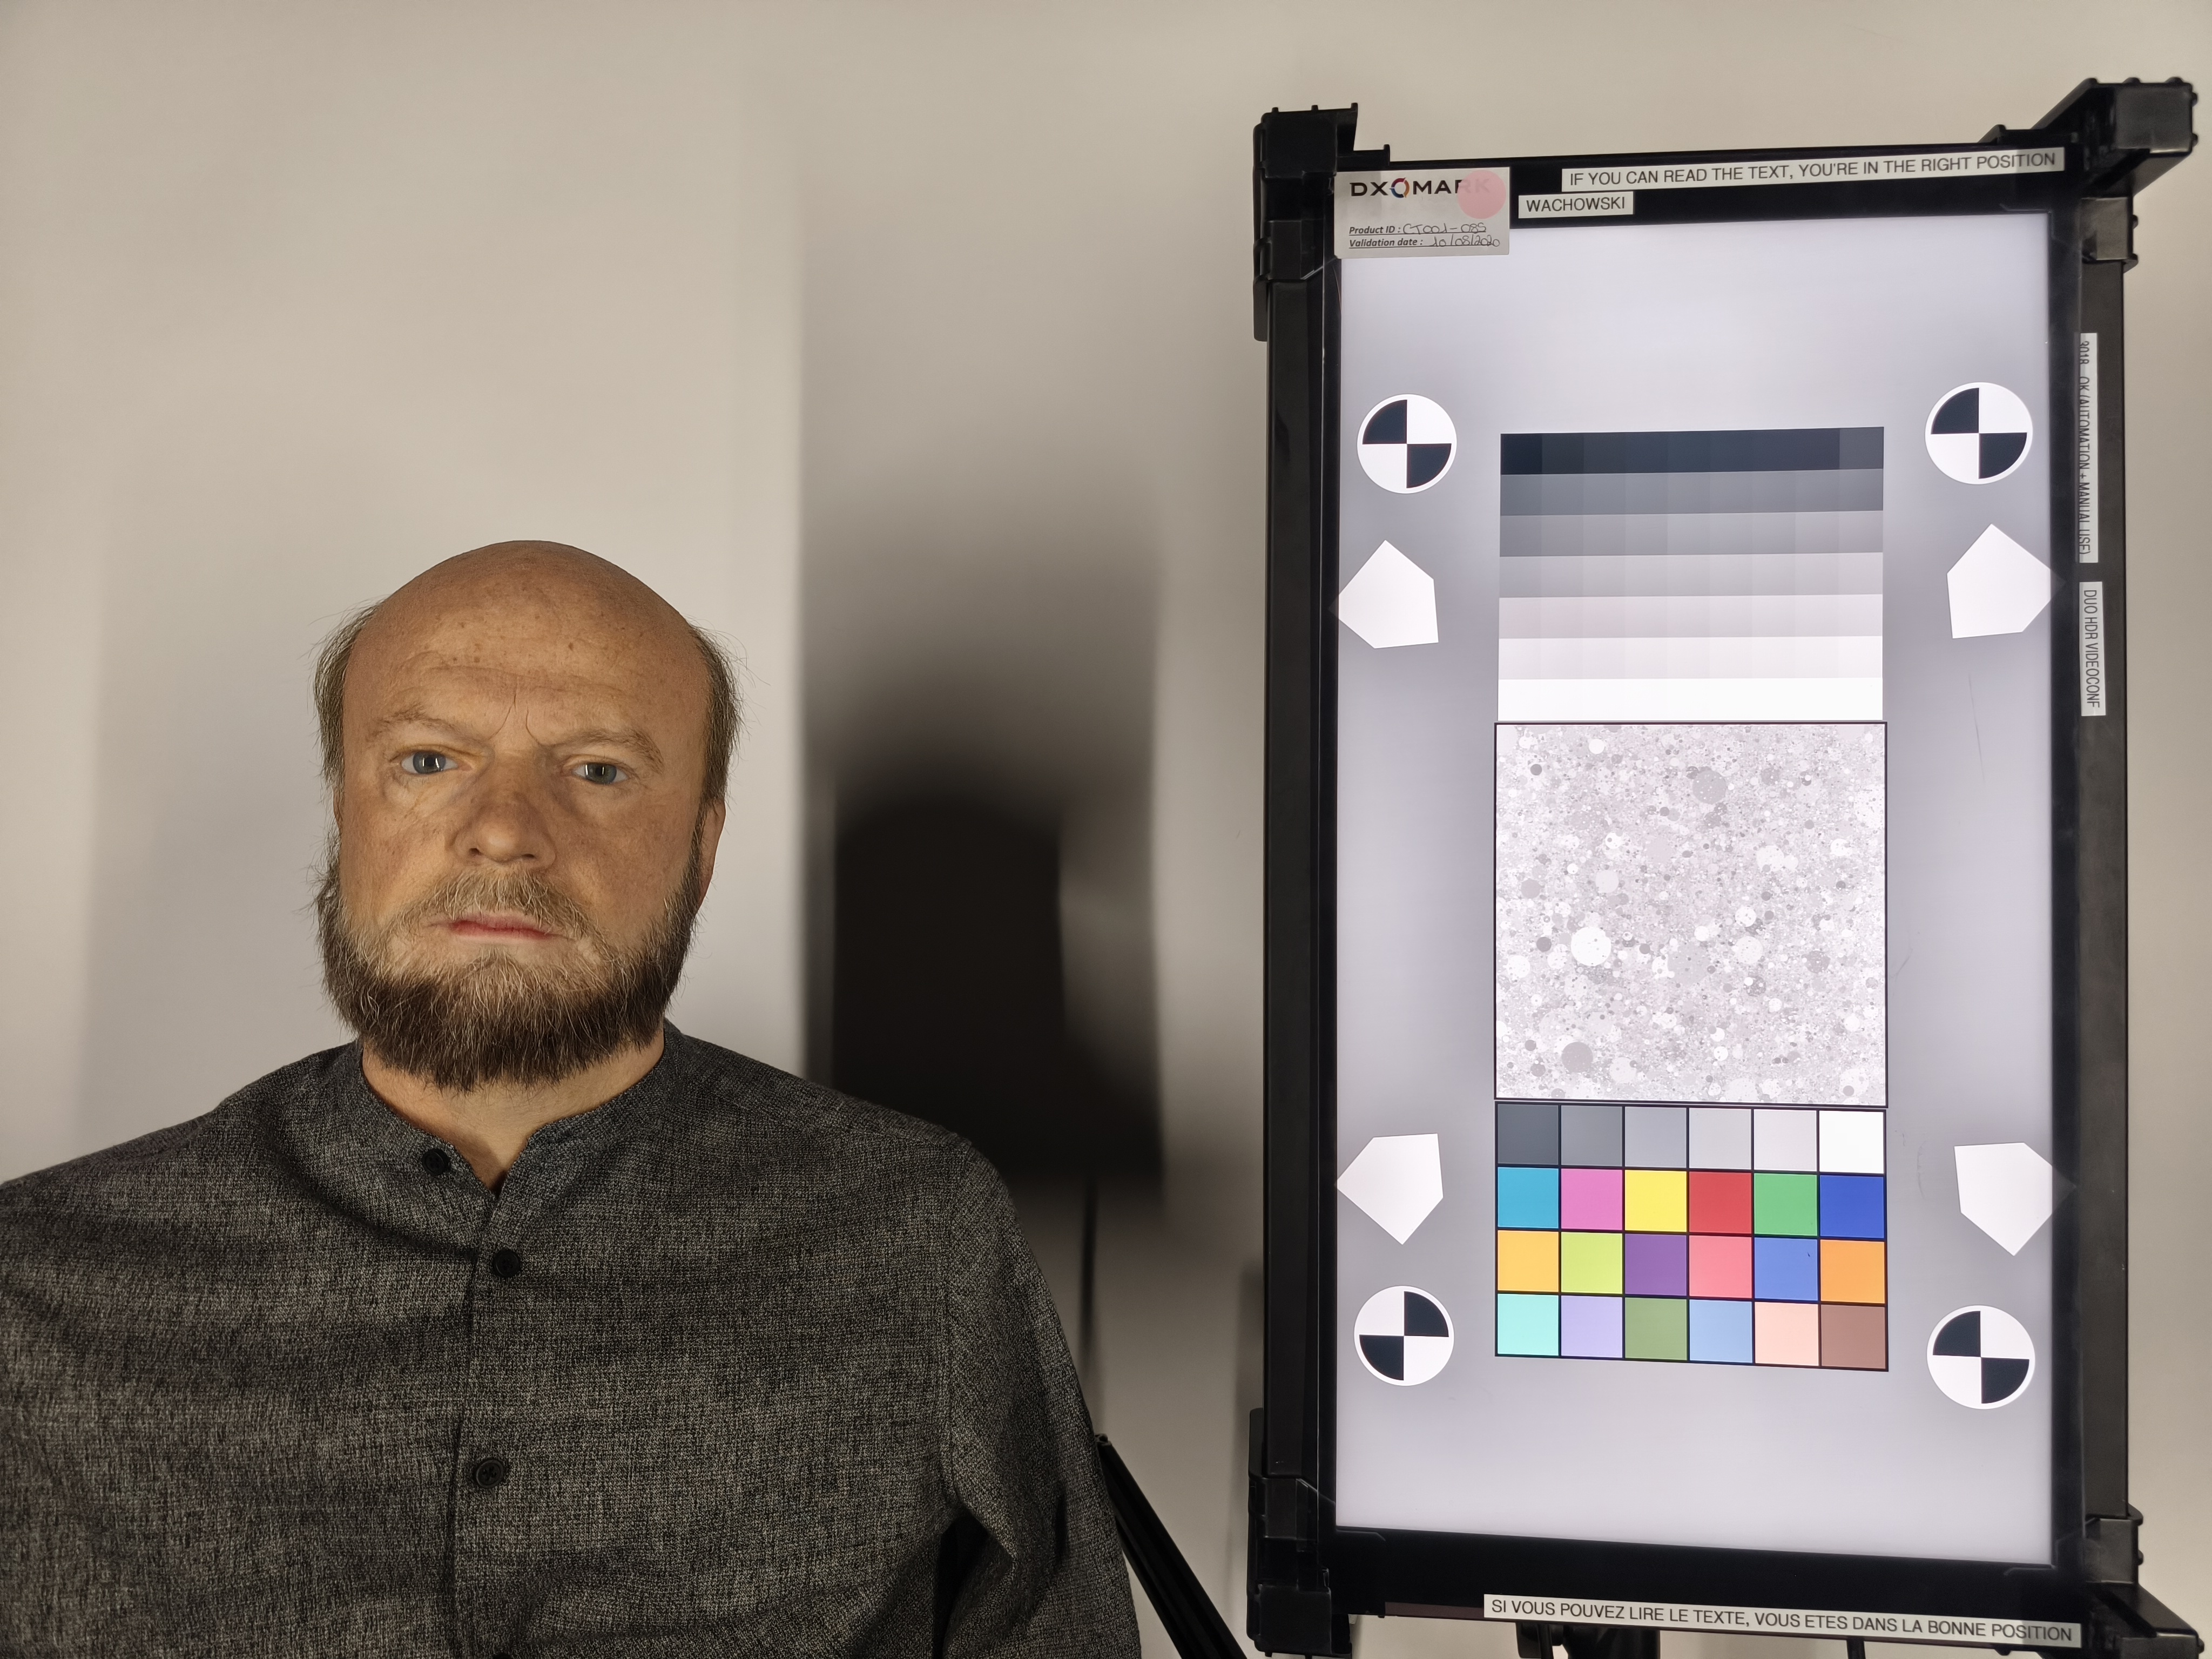
For scoring and analysis, DXOMARK engineers capture and evaluate more than 2,600 test images both in controlled lab environments and in outdoor, indoor and low-light natural scenes, using the camera’s default settings. The photo protocol is designed to take into account the main use cases and is based on typical shooting scenarios, such as portraits, family, and landscape photography. The evaluation is performed by visually inspecting images against a reference of natural scenes, and by running objective measurements on images of charts captured in the lab under different lighting conditions from 1 to 1,000+ lux and color temperatures from 2,300K to 6,500K.
In our Photo tests, the Xiaomi 14T Pro delivered an overall good performance, achieving slightly better results than the Xiaomi 14. Exposure was mostly good, as long as there was not too much contrast in the scene. In high-contrast scenes, a lack of dynamic range could result in clipped highlights. Our testers also observed some exposure instabilities across a series of consecutive shots. The camera produced nice skin tones in bright light, but color casts were noticeable when shooting in low light light and white balance could be unstable.
The autofocus system worked accurately and a wide depth of field allowed for good sharpness across multiple subject planes. The level of detail in the Xiaomi’s still images was quite high but we noticed a loss of fine detail in most test conditions. The 14T Pro was overall slightly worse than the Xiaomi 14 in this respect. Ghosting and fusion artifacts could be noticeable when capturing high-contrast scenes, as well as a hue shift around clipped areas.

Exposure
Xiaomi 14T Pro
130

Color
Xiaomi 14T Pro
130
Exposure and color are the key attributes for technically good pictures. For exposure, the main attribute evaluated is the brightness of the main subject through various use cases such as landscape, portrait, or still life. Other factors evaluated are the contrast and the dynamic range, eg. the ability to render visible details in both bright and dark areas of the image. Repeatability is also important because it demonstrates the camera's ability to provide the same rendering when shooting several images of the same scene.
For color, the image quality attributes analyzed are skin-tone rendering, white balance, color shading, and repeatability. For color and skin tone rendering, we penalize unnatural colors but we respect a manufacturer's choice of color signature.


Autofocus
Xiaomi 14T Pro
125
Autofocus tests concentrate on focus accuracy, focus repeatability, shooting time delay, and depth of field. Shooting delay is the difference between the time the user presses the capture button and the time the image is actually taken. It includes focusing speed and the capability of the device to capture images at the right time, what is called 'zero shutter lag' capability. Even if a shallow depth of field can be pleasant for a single-subject portrait or close-up shot, it can also be a problem in some specific conditions such as group portraits; Both situations are tested. Focus accuracy is also evaluated in all the real-life images taken, from infinity to close-up objects and in low light to outdoor conditions.

Texture
Xiaomi 14T Pro
125
Texture tests analyze the level of details and the texture of subjects in the images taken in the lab as well as in real-life scenarios. For natural shots, particular attention is paid to the level of details in the bright and dark areas of the image. Objective measurements are performed on chart images taken in various lighting conditions from 1 to 1000 lux and different kinds of dynamic range conditions. The charts used are the proprietary DXOMARK chart (DMC) and the Dead Leaves chart.

Noise
Xiaomi 14T Pro
117
Noise tests analyze various attributes of noise such as intensity, chromaticity, grain, and structure on real-life images as well as images of charts taken in the lab. For natural images, particular attention is paid to the noise on faces, landscapes, but also on dark areas and high dynamic range conditions. Noise on moving objects is also evaluated on natural images. Objective measurements are performed on images of charts taken in various conditions from 1 to 1000 lux and different kinds of dynamic range conditions. The chart used is the Dead Leaves chart and the standardized measurement such as Visual Noise derived from ISO 15739.

Artifacts
Xiaomi 14T Pro
82
The artifacts evaluation looks at lens shading, chromatic aberrations, geometrical distortion, edges ringing, halos, ghosting, quantization, unexpected color hue shifts, among others type of possible unnatural effects on photos. The more severe and the more frequent the artifact, the higher the point deduction on the score. The main artifacts observed and corresponding point loss are listed below.
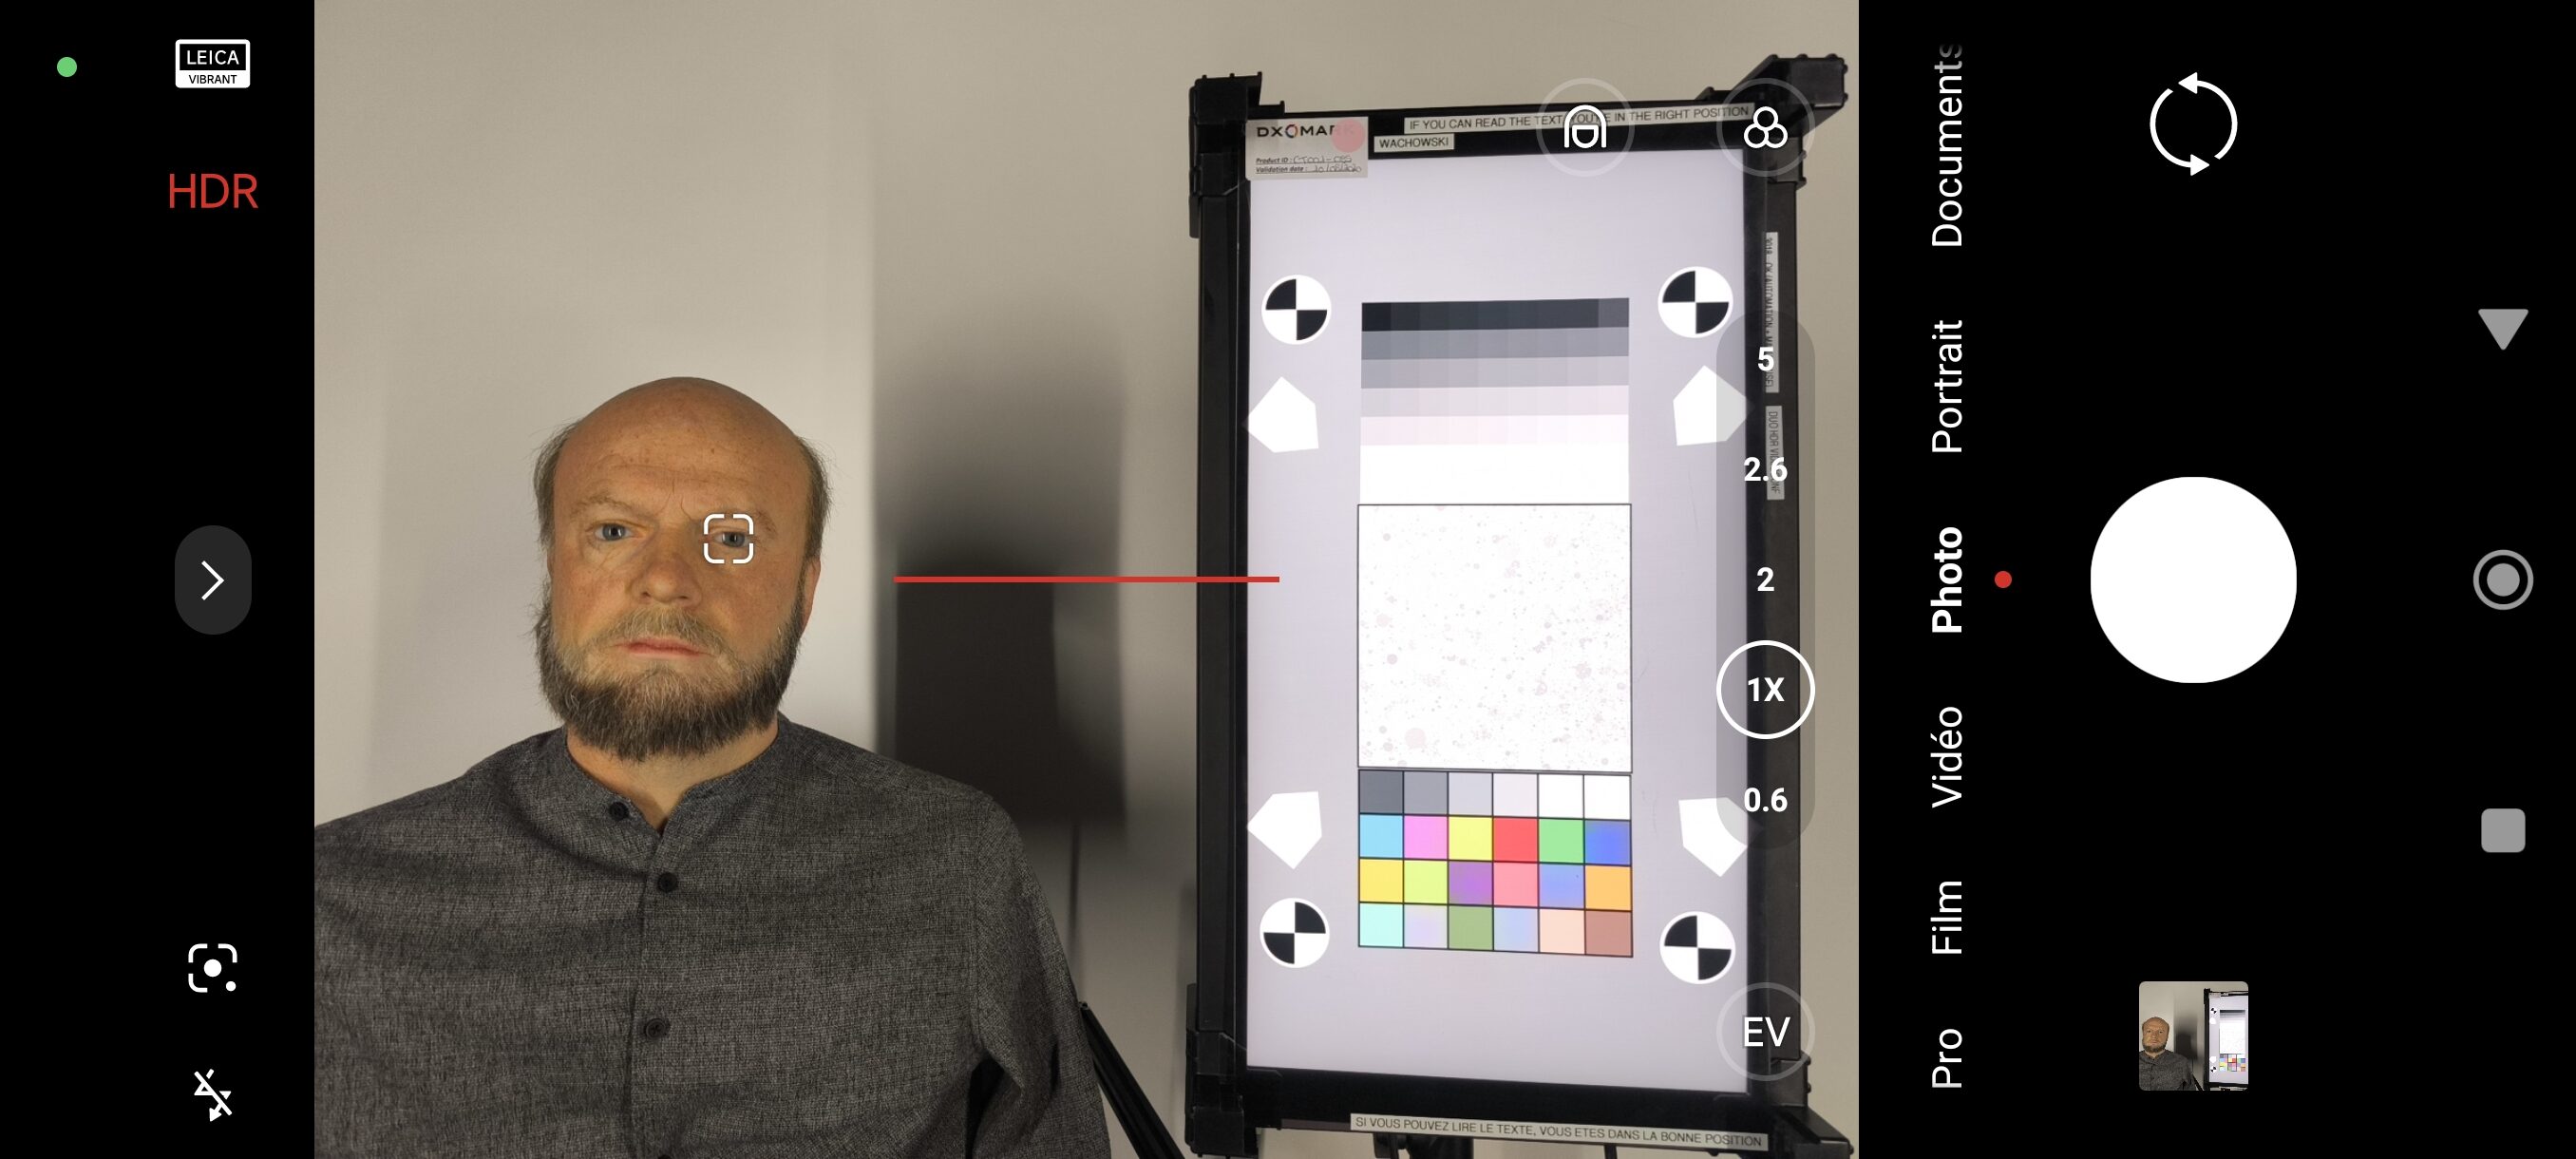
Preview
Xiaomi 14T Pro
93
Preview tests analyze the image quality of the camera app's preview of the image, with particular attention paid to the difference between the capture and the preview, especially regarding dynamic range and the application of the bokeh effect. Also evaluated is the smoothness of the exposure, color and focus adaptation when zooming from the minimal to the maximal zoom factor available. The preview frame rate is measured using the LED Universal Timer.
Zoom
Xiaomi 14T Pro
169
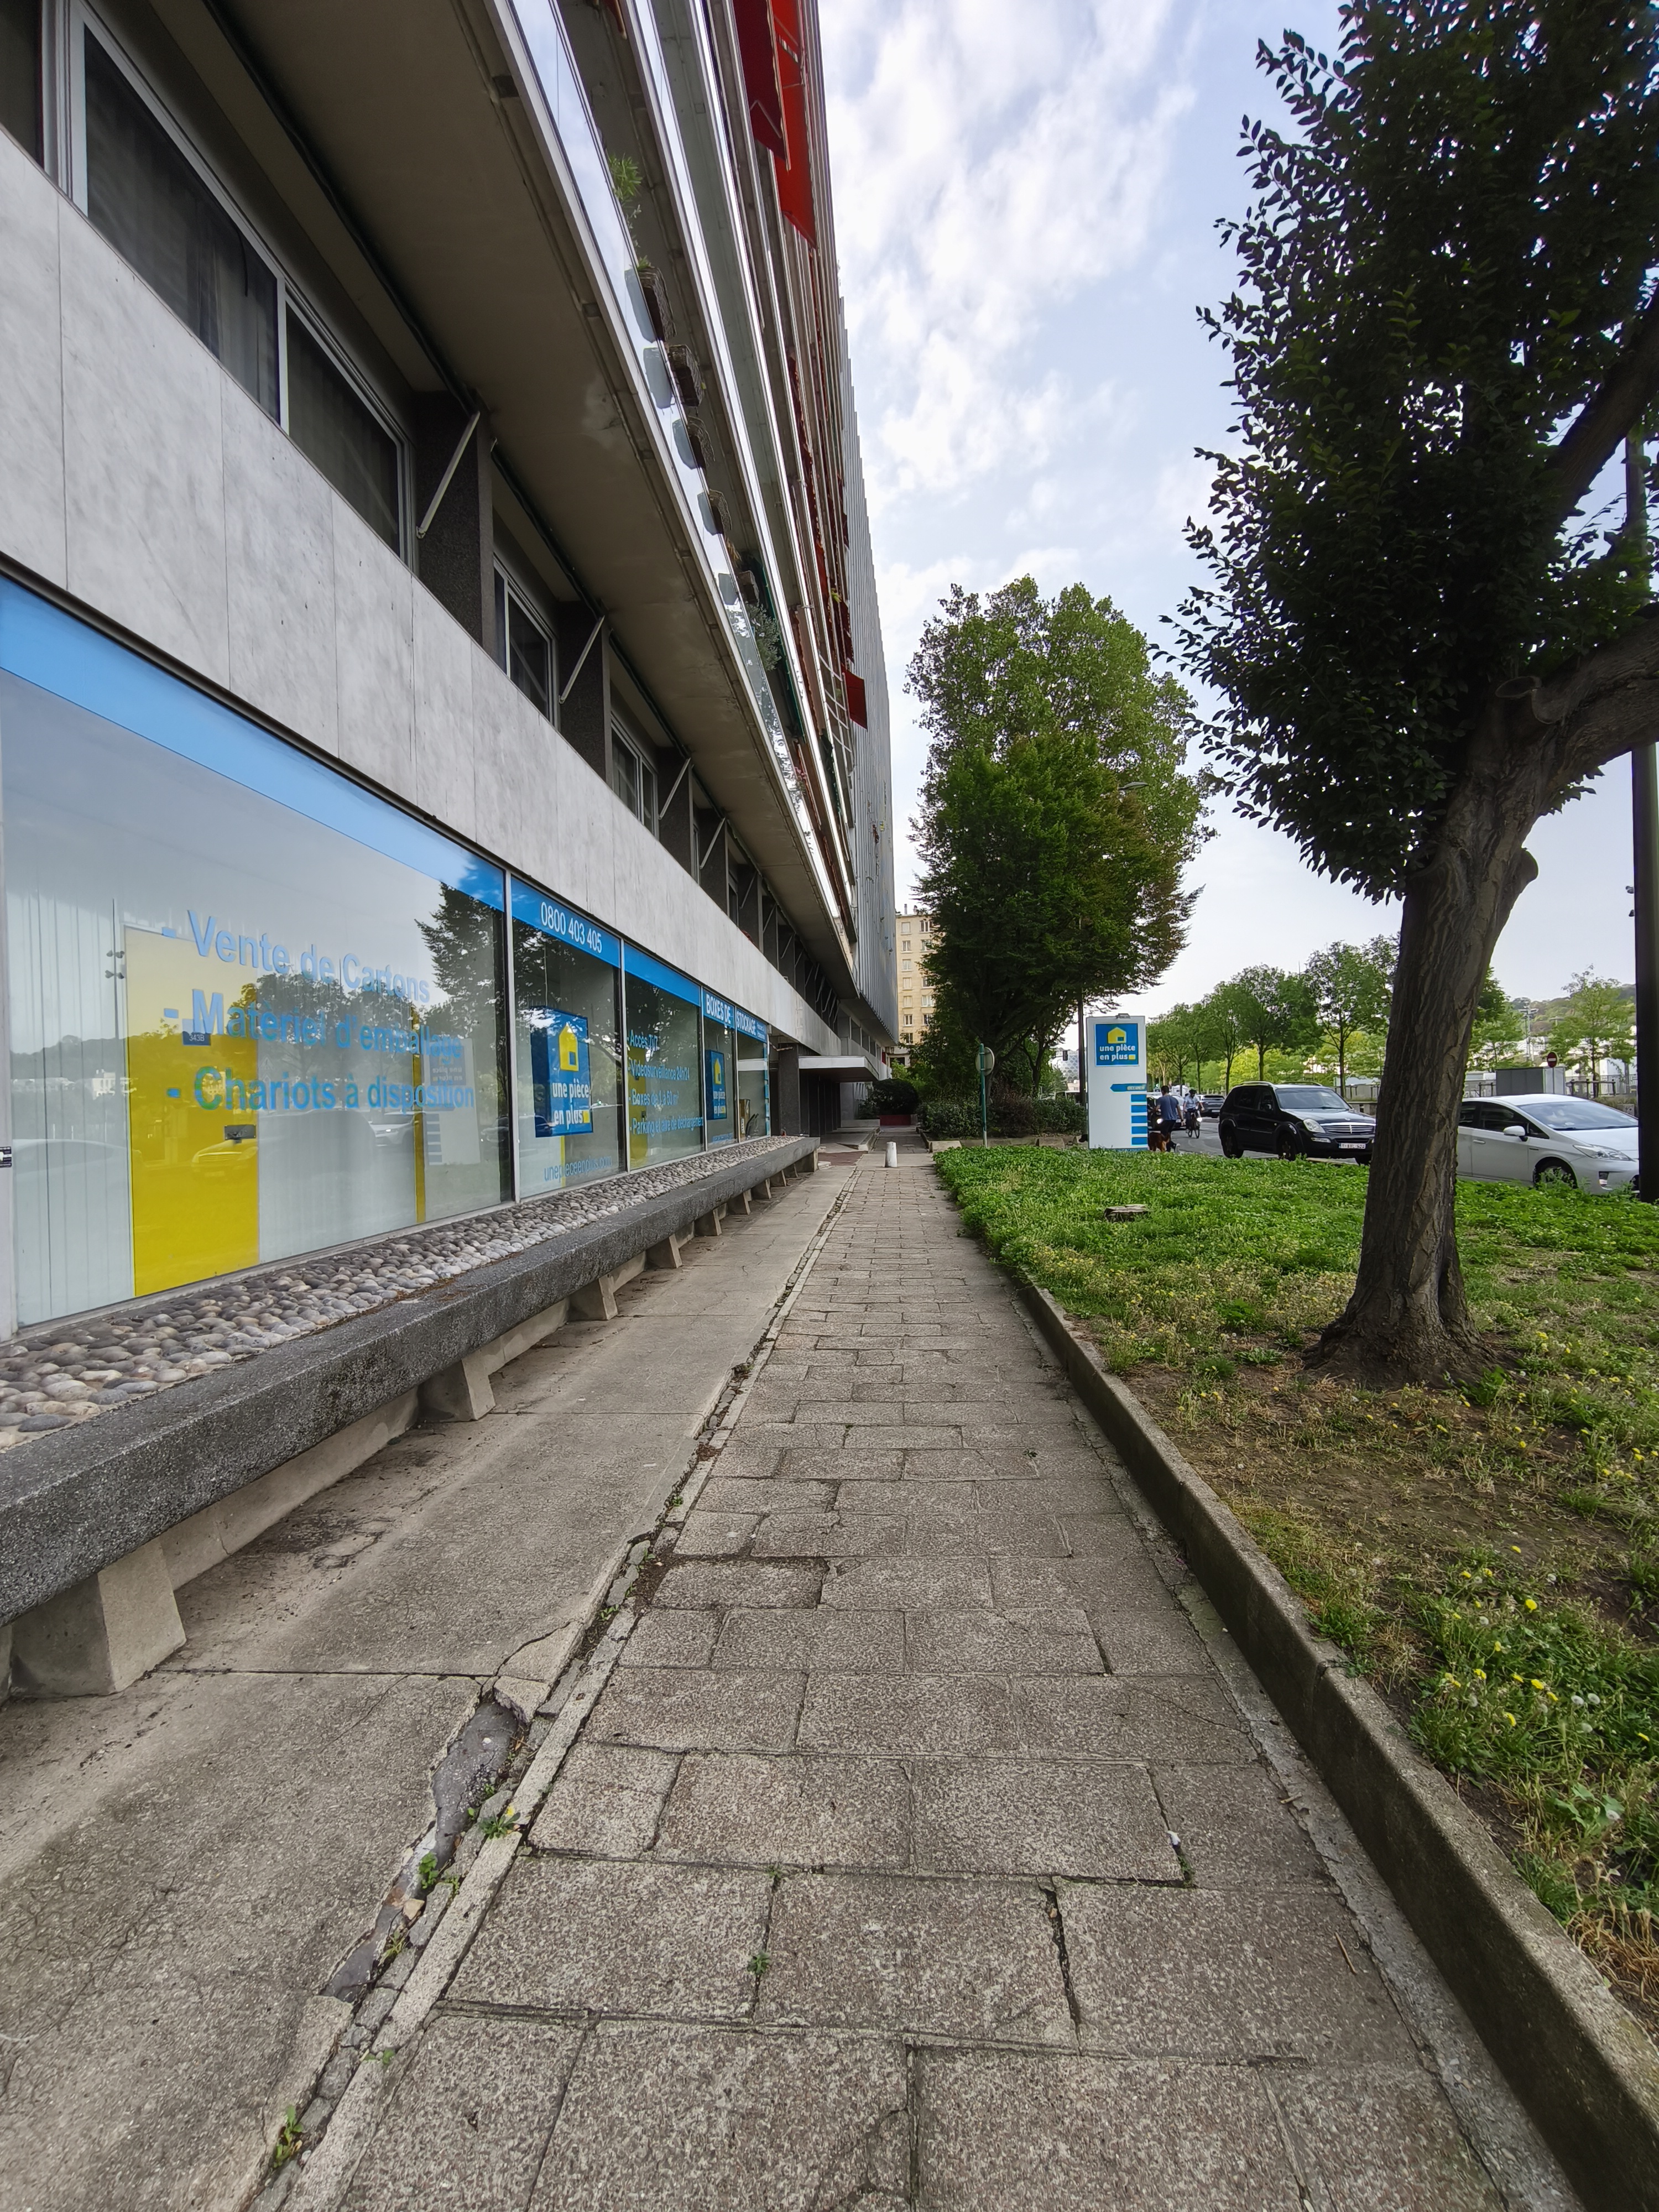
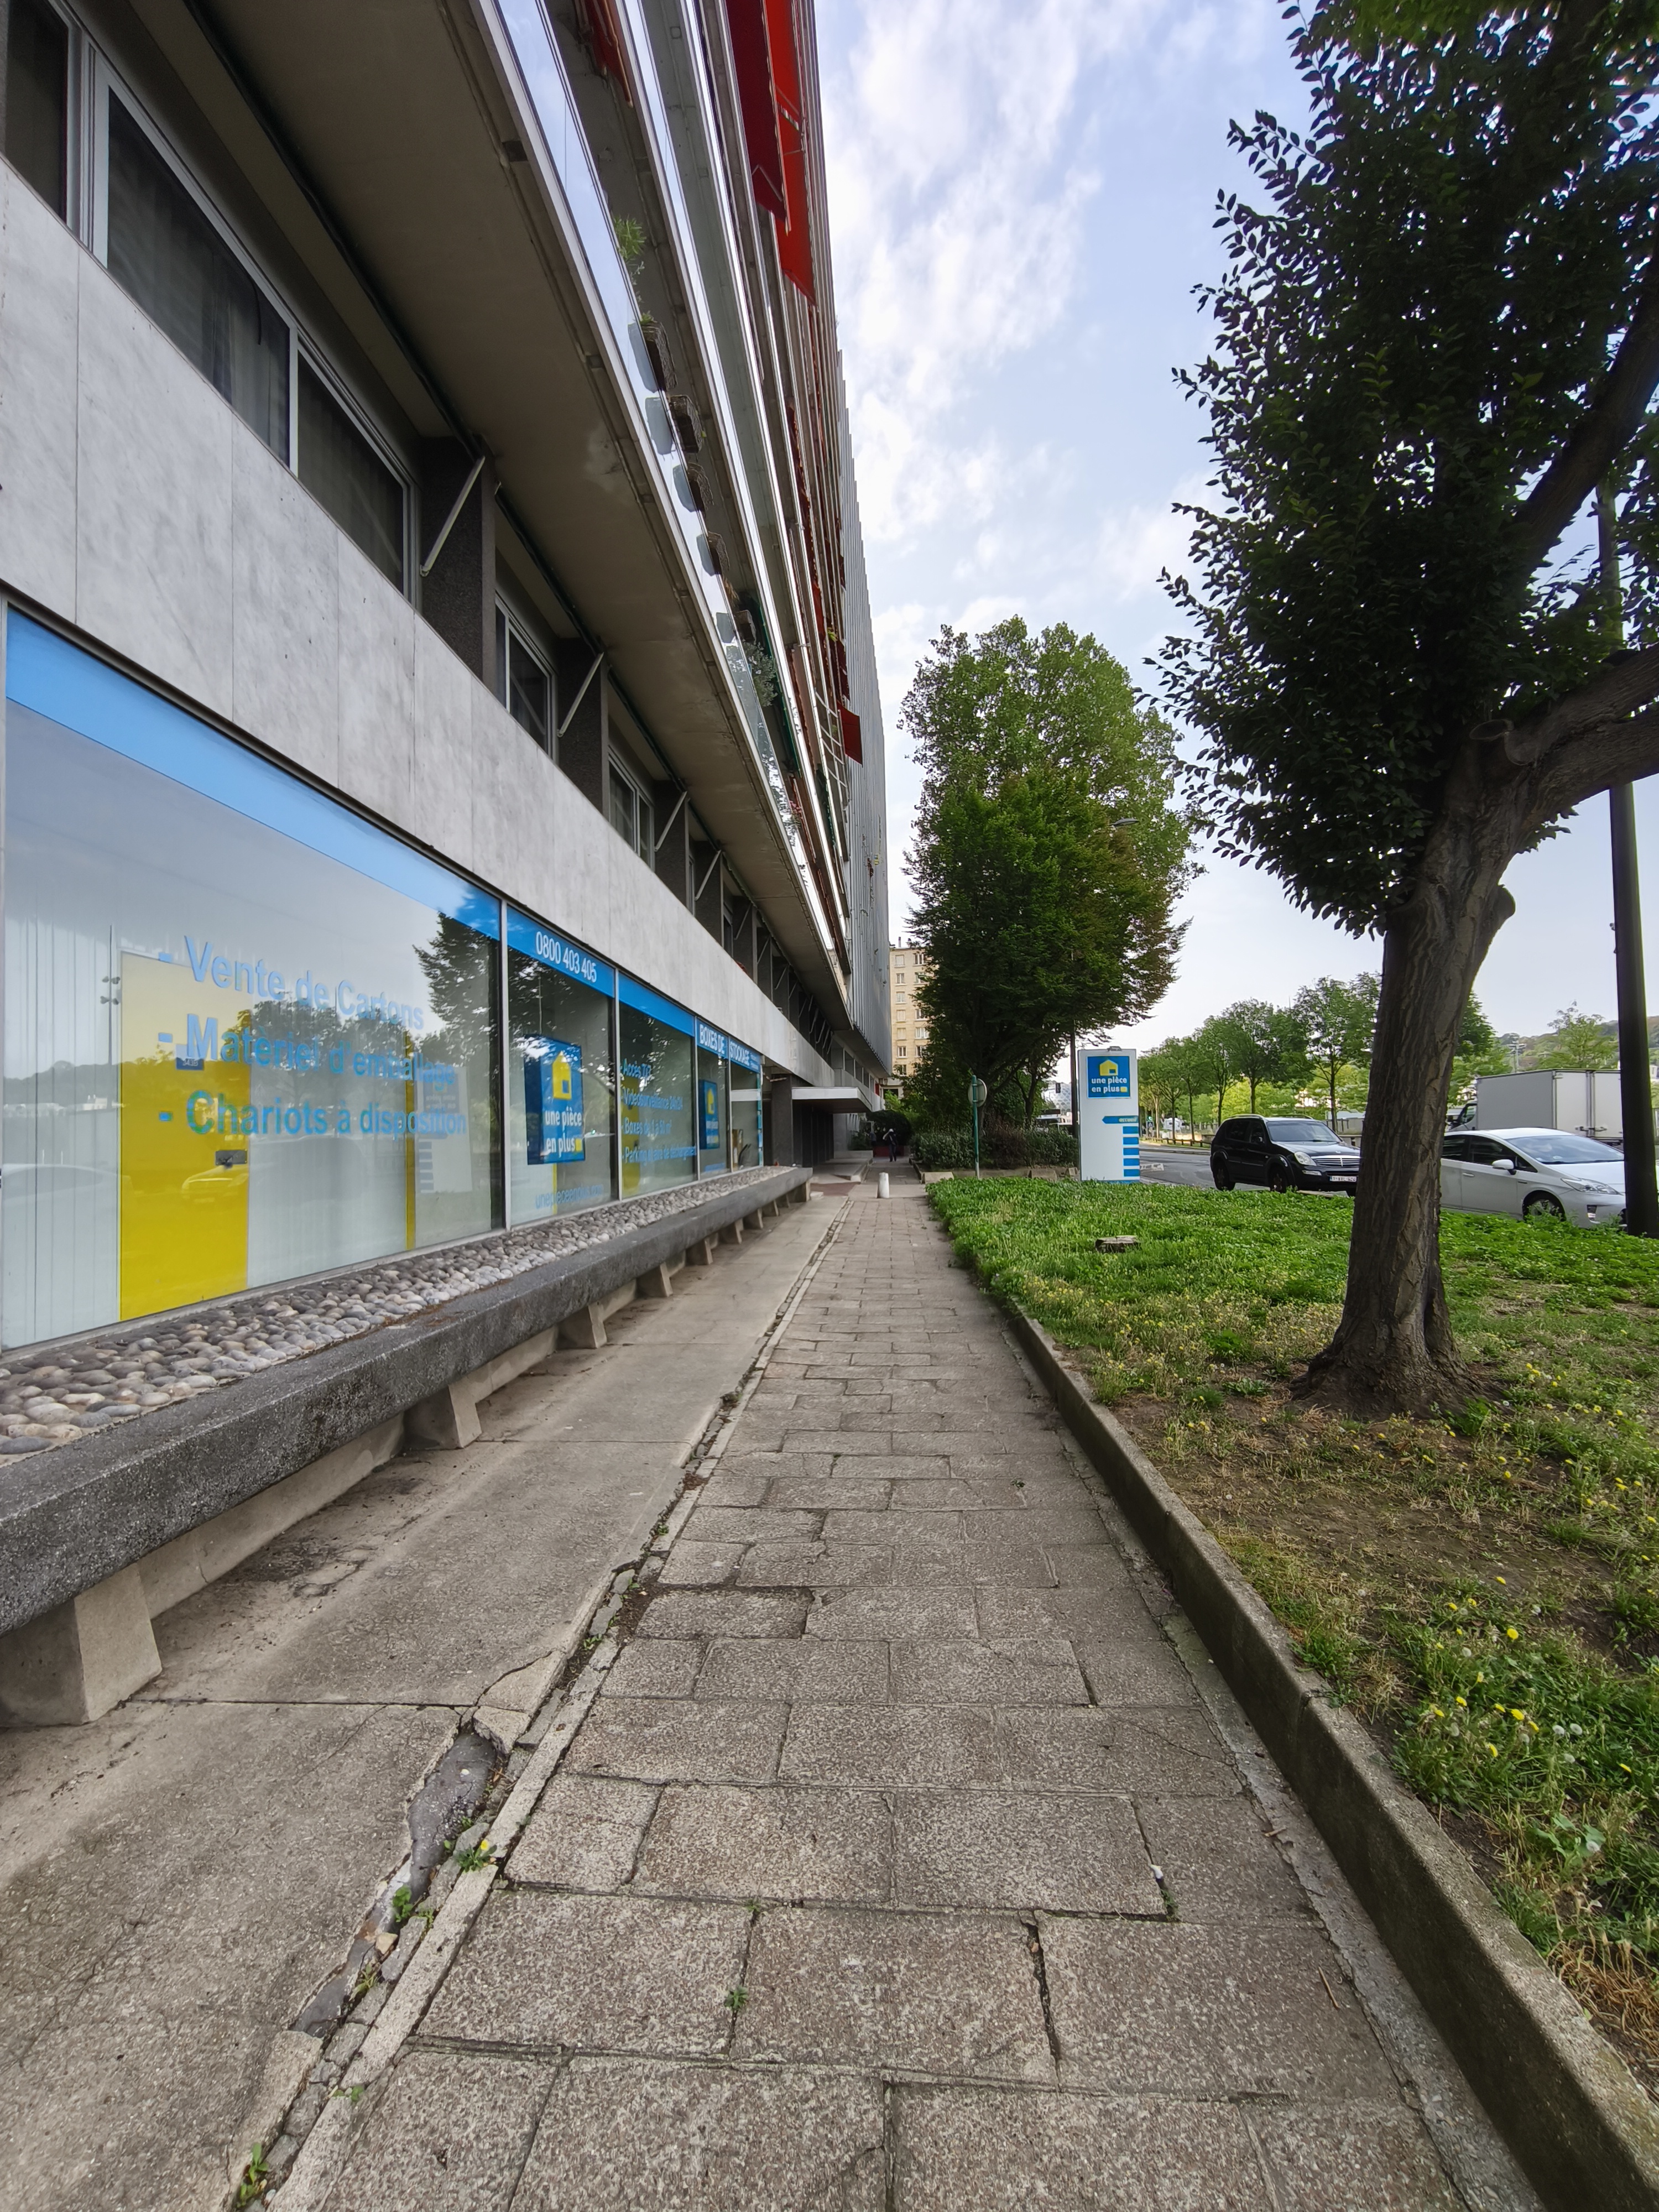
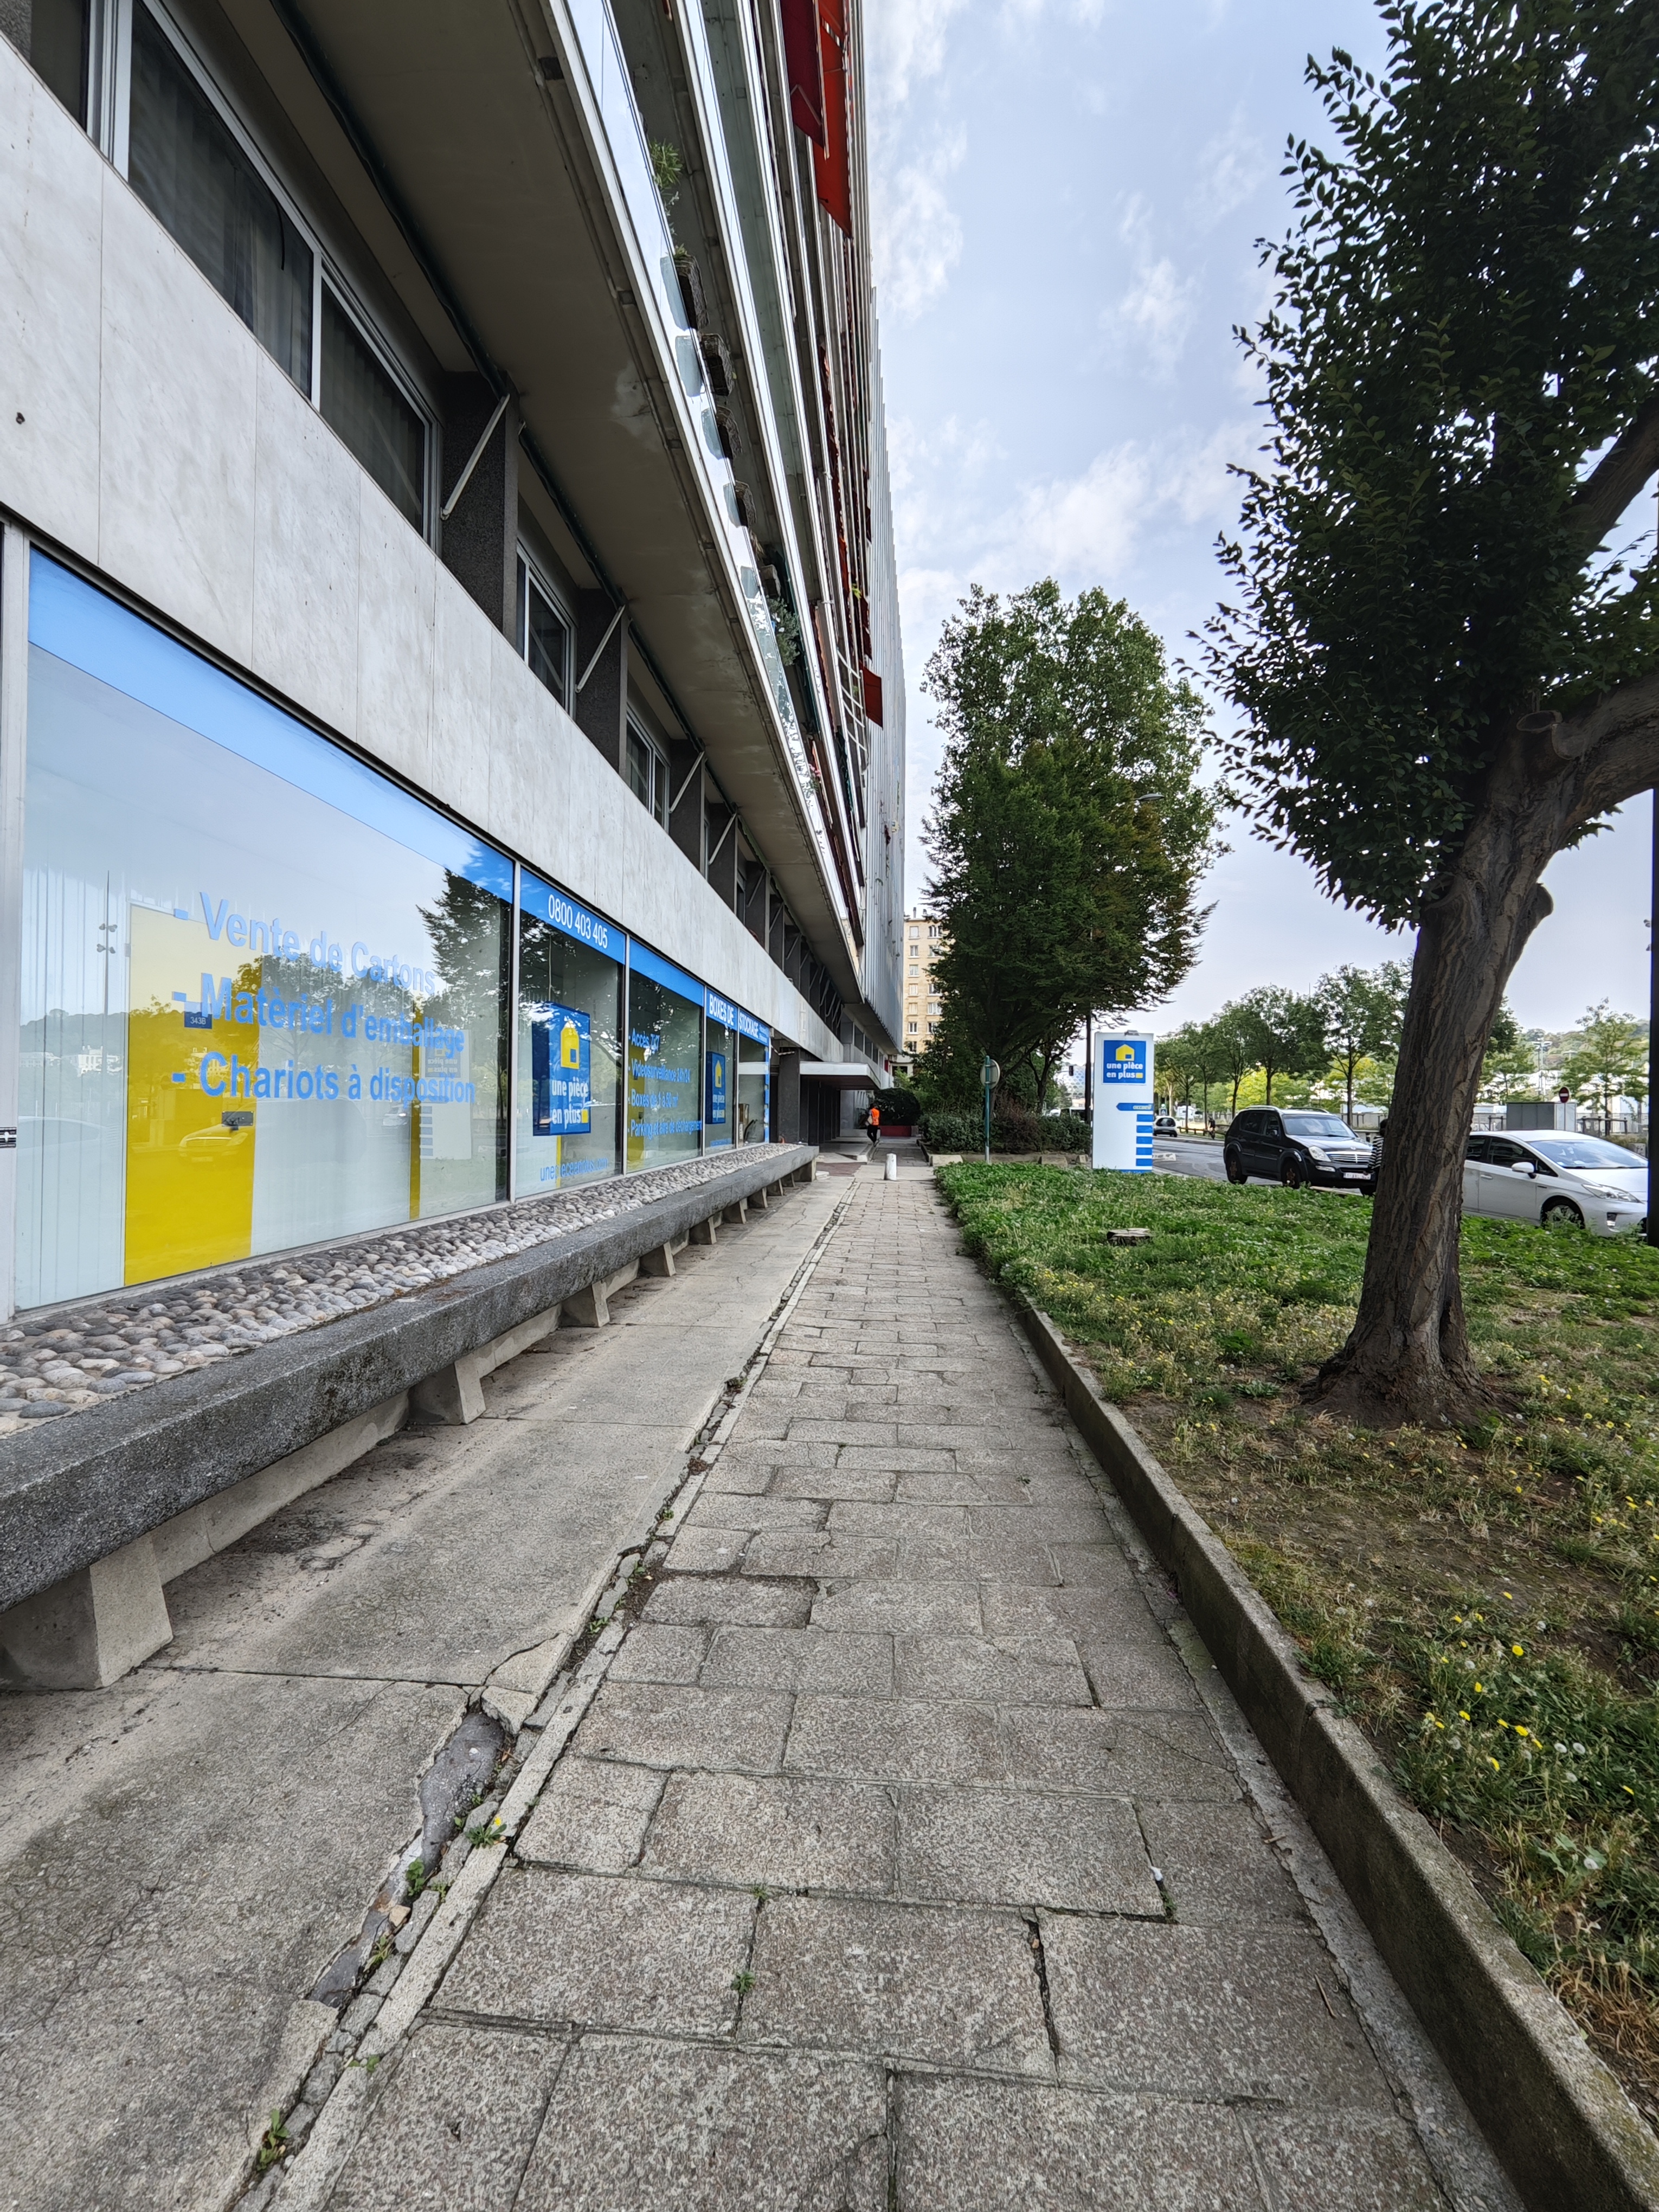
DXOMARK engineers capture and evaluate over 400 test images in controlled lab environments and in outdoor, indoor, and low-light natural scenes, using the camera’s default settings and pinch zoom at various zoom factors from ultra wide to very long-range zoom. The evaluation is performed by visually inspecting the images against a reference of natural scenes, and by running objective measurements of chart mages captured in the lab under different conditions from 20 to 1000 lux and color temperatures from 2300K to 6500K.
When using the ultra-wide camera or tele-zooming, the 14T Pro delivered very similar, but slightly better results than the Xiaomi 14. Target exposure was accurate, with nice colors in bright light and when shooting indoors. On occasions a slightly warm but pleasant cast could be noticeable. Camera performance was fairly stable across consecutives shots. However, the level of captured detail could be low and artifacts, such as color fringing, anamorphosis and edge softness, could be noticeable.
When tele-zooming, the tele camera provided decent quality at close and medium range settings, albeit with a lack of detail. After switching to the dedicated tele module, image quality was quite acceptable, with a wide dynamic range, accurate exposure and nice colors. It could not quite match the Xiaomi 14 Ultra, though.

Wide
Xiaomi 14T Pro
122
These tests analyze the performance of the ultra-wide camera at several focal lengths from 12 mm to 20 mm. All image quality attributes are evaluated, with particular attention paid to such artifacts as chromatic aberrations, lens softness, and distortion. Pictures below are an extract of tested scenes.

Tele
Xiaomi 14T Pro
128
All image quality attributes are evaluated at focal lengths from approximately 40 mm to 300 mm, with particular attention paid to texture and detail. The score is derived from a number of objective measurements in the lab and perceptual analysis of real-life images.
Video
Xiaomi 14T Pro
159
DXOMARK engineers capture and evaluate more than 2.5 hours of video in controlled lab environments and in natural low-light, indoor and outdoor scenes, using the camera’s default settings. The evaluation consists of visually inspecting natural videos taken in various conditions and running objective measurements on videos of charts recorded in the lab under different conditions from 1 to 1000+ lux and color temperatures from 2,300K to 6,500K.
In video mode, our testers observed some improvements over previous models, especially when using the HDR mode. Exposure was mostly accurate, with a wide dynamic range. However, exposure adaptation issues could sometimes be noticable. Colors were often desaturated when recording under daylight conditions, and color casts were noticeable in low light. The autofocus was stable and smooth in most test conditions. The level of recorded texture was overall quite high but a loss of fine detail was evident. Video noise was well managed in bright conditions, but noise could be a little intrusive in low-light clips. The stabilization system worked effectively when standing still or moving during recording, but sharpness difference between individual video frames could be noticeable.
Exposure
Xiaomi 14T Pro
116
Color
Xiaomi 14T Pro
120
Exposure tests evaluate the brightness of the main subject and the dynamic range, eg. the ability to render visible details in both bright and dark areas of the image. Stability and temporal adaption of the exposure are also analyzed.
Image-quality color analysis looks at color rendering, skin-tone rendering, white balance, color shading, stability of the white balance and its adaption when light is changing.
Texture
Xiaomi 14T Pro
118
Texture tests analyze the level of details and texture of the real-life videos as well as the videos of charts recorded in the lab. Natural videos recordings are visually evaluated, with particular attention paid to the level of details in the bright and areas as well as in the dark. Objective measurements are performed of images of charts taken in various conditions from 1 to 1000 lux. The charts used are the DXOMARK chart (DMC) and Dead Leaves chart.
Noise
Xiaomi 14T Pro
120
Noise tests analyze various attributes of noise such as intensity, chromaticity, grain, structure, temporal aspects on real-life video recording as well as videos of charts taken in the lab. Natural videos are visually evaluated, with particular attention paid to the noise in the dark areas and high dynamic range conditions. Objective measurements are performed on the videos of charts recorded in various conditions from 1 to 1000 lux. The chart used is the DXOMARK visual noise chart.

Stabilization
Xiaomi 14T Pro
119
Stabilization evaluation tests the ability of the device to stabilize footage thanks to software or hardware technologies such as OIS, EIS, or any others means. The evaluation looks at residual motion, smoothness, jellow artifacts and residual motion blur on walk and run use cases in various lighting conditions. The video below is an extract from one of the tested scenes.
Artifacts
Xiaomi 14T Pro
86
Artifacts are evaluated with MTF and ringing measurements on the SFR chart in the lab as well as frame-rate measurements using the LED Universal Timer. Natural videos are visually evaluated by paying particular attention to artifacts such as aliasing, quantization, blocking, and hue shift, among others. The more severe and the more frequent the artifact, the higher the point deduction from the score. The main artifacts and corresponding point loss are listed below.